Choosing a mobile library stop is not simply a matter of finding an empty place far from a fixed library branch. A useful stop should reach communities with fewer alternatives while remaining close enough to roads and familiar destinations to be practical for a traveling service. Suitability analysis turns that balancing act into a spatial question: where do community need and logistical feasibility align?
The analysis began with statewide data and used census block groups to emphasize smaller-population communities. Existing libraries, primary and secondary roads, K–12 schools, and age-based Census counts supplied the remaining criteria.
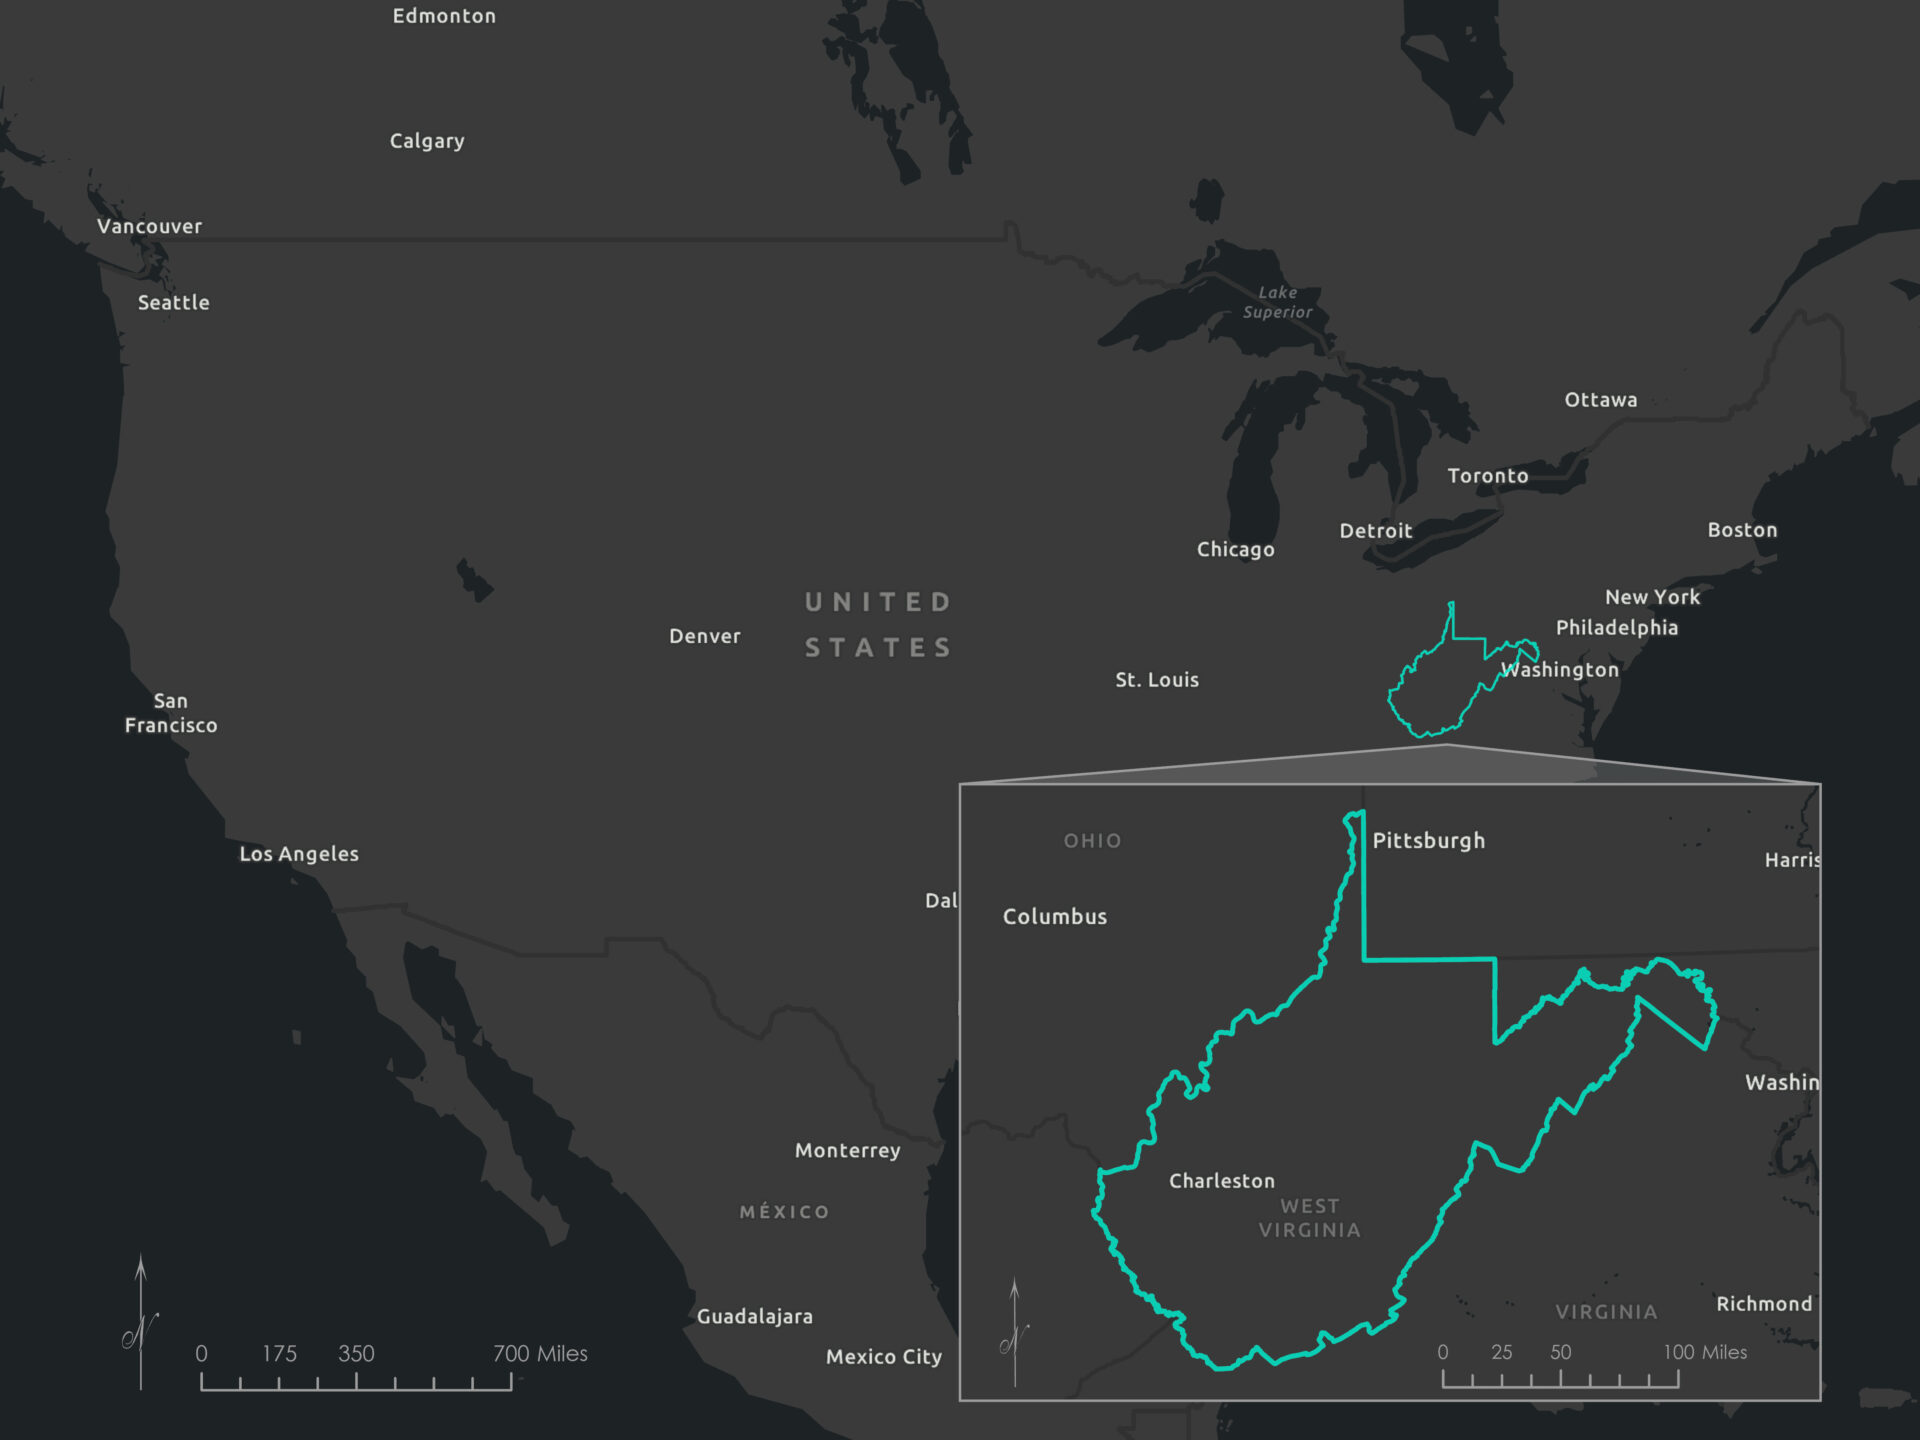
To examine how the choice of method shapes the answer, this project compared two vector-based map overlay techniques. Vector overlay combines mapped points, lines, and polygons according to where their locations and boundaries coincide:
- Boolean overlay treats every criterion as a requirement. A location must satisfy all five conditions to remain in the result.
- Weighted Linear Combination (WLC) assigns scores and weights to the criteria, allowing stronger performance in one area to compensate for weaker performance in another.
Framing the siting problem
Five criteria represented two sides of the siting decision: community need and operational feasibility. Population characteristics and distance from existing libraries helped identify communities that might benefit from additional service. Proximity to roads and schools helped identify areas that would be more practical to reach and connect with familiar community destinations.
| Criterion | Role in the analysis | Data source |
|---|---|---|
| Fewer than 500 residents per census block group | Emphasize smaller-population communities | USA 2020 Census Population Characteristics |
| More than 300 residents under 18 or over 65 | Prioritize areas with larger youth and older-adult populations | USA 2020 Census Population Characteristics |
| More than five miles from an existing library | Identify potential gaps in fixed-library coverage | West Virginia Public Libraries |
| Within 0.1 mile of a primary or secondary road | Support operational accessibility for a bookmobile | 2024 TIGER/Line Roads |
| Within one mile of a K–12 school | Use schools as potential community anchors | K-12 Public Schools, West Virginia |
All source data were downloaded in July 2025, clipped to the West Virginia boundary, and projected to NAD 1983 StatePlane West Virginia South FIPS 4702 (Feet) to support distance-based geoprocessing.
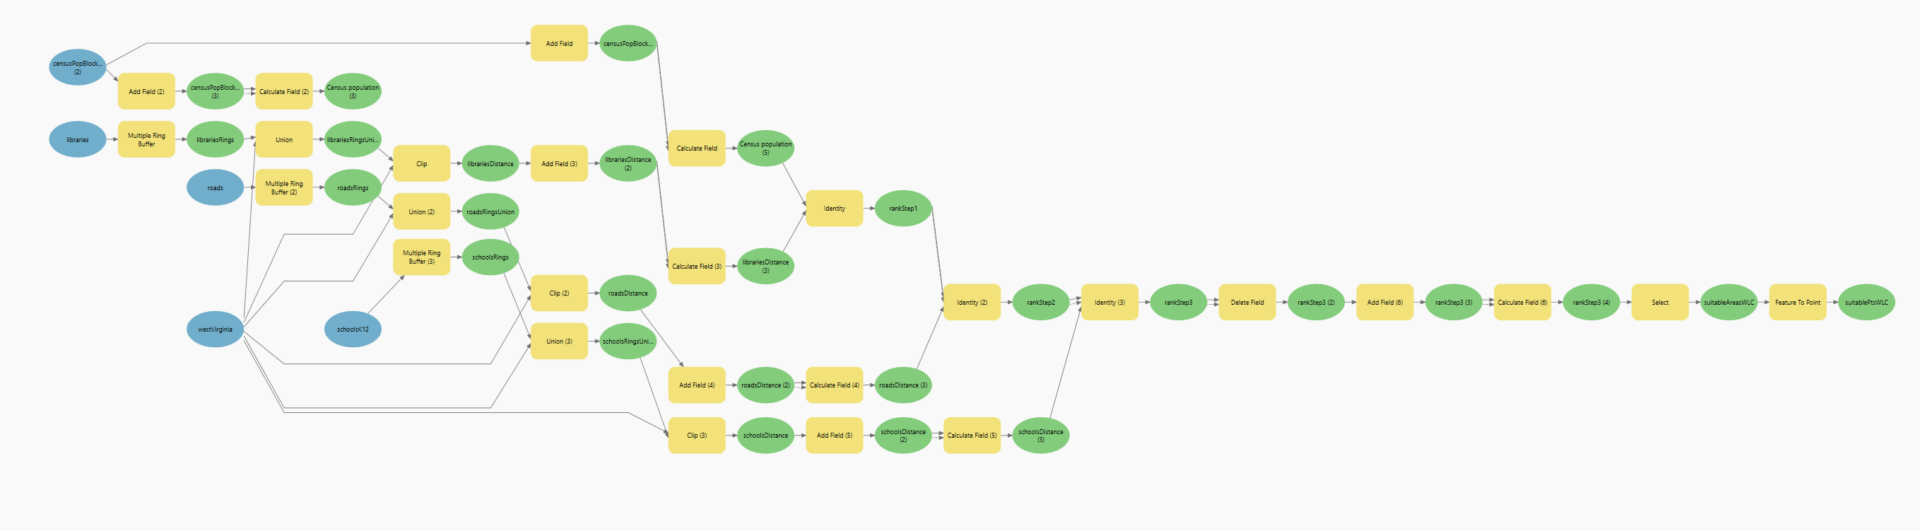
Both analytical techniques were organized in ArcGIS Pro’s ModelBuilder. ModelBuilder connects geoprocessing tools and intermediate datasets in a visual workflow, making the sequence easier to inspect, modify, and run consistently. In this project, the two models also make the methodological difference visible: one narrows the map through strict filters, while the other builds a composite score through ranked tradeoffs.
Every condition must be met
Boolean suitability analysis treats each criterion as a yes-or-no gate. An area is either suitable or unsuitable under each rule, and only areas that satisfy all five conditions survive the final overlay. This makes the result transparent and conservative, although an area that narrowly misses one threshold is excluded regardless of how strongly it performs elsewhere.
The Boolean model required candidate areas to meet all five conditions:
- Fewer than 500 residents per census block group
- More than 300 residents under 18 or over 65
- Within 0.1 mile of a primary or secondary road
- More than five miles from a fixed library
- Within one mile of a K–12 school
In ModelBuilder, attribute selections isolated the two population groups, buffers represented the road, school, and library distances, and an erase operation removed areas within five miles of a library. The Intersect tool then retained only the geometry shared by all five qualifying layers.
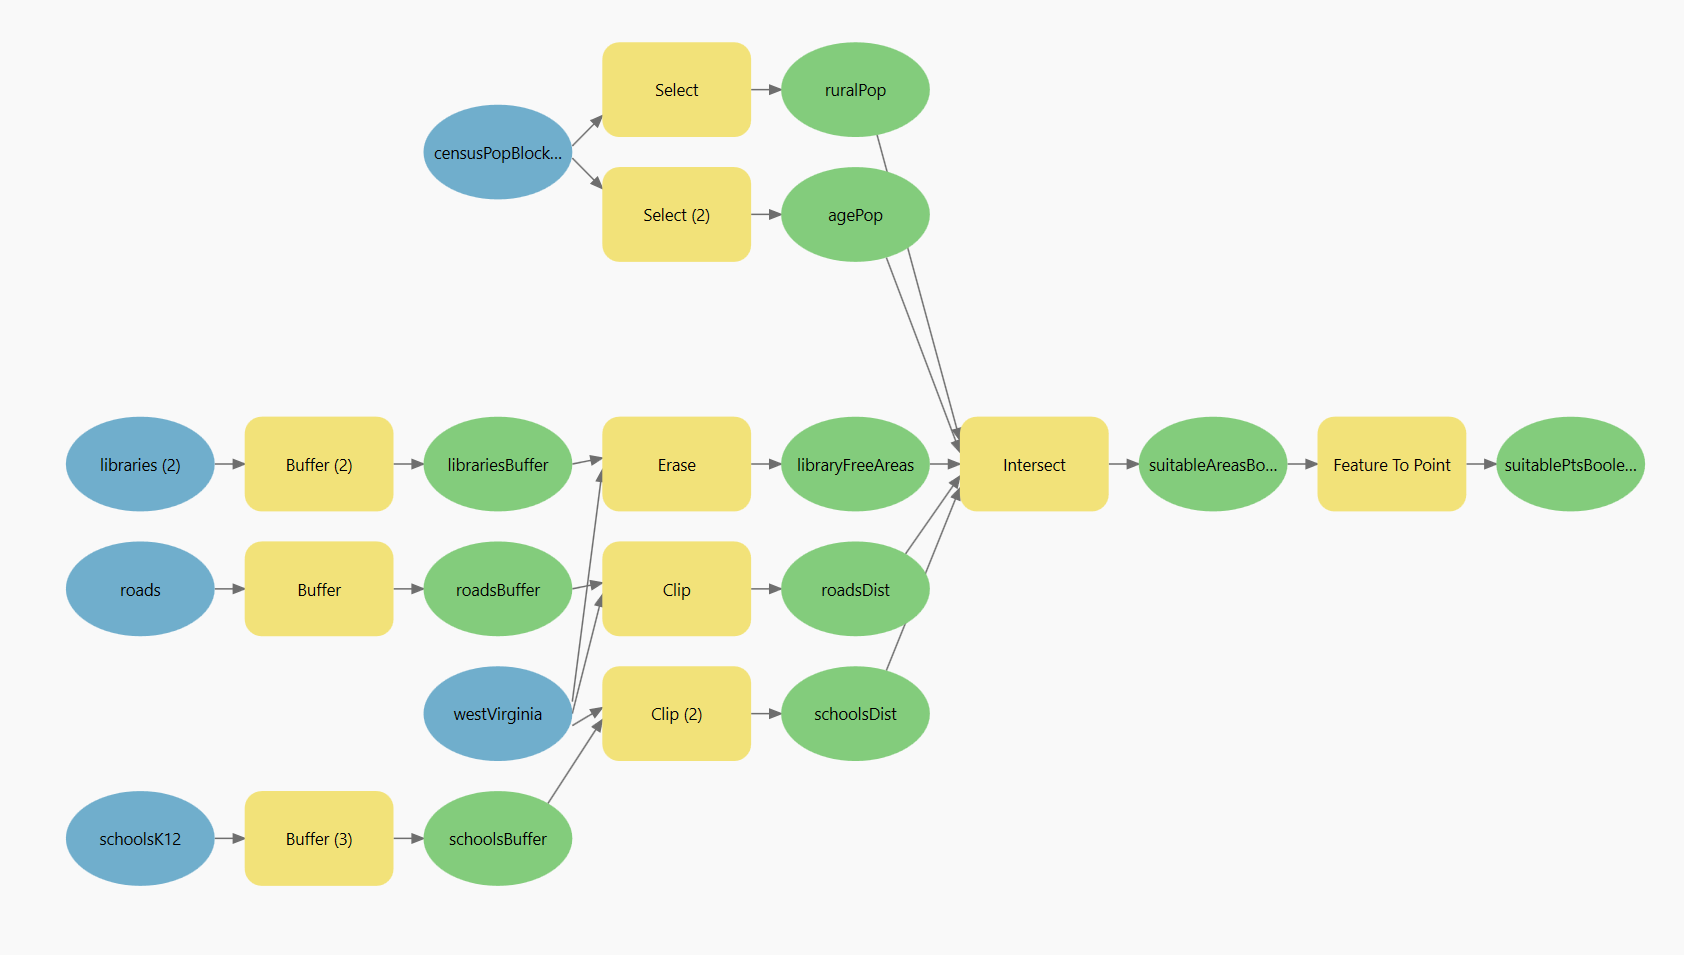
Before they were intersected, the five criteria covered very different portions of the state. Each map below shows one gate in the Boolean model.
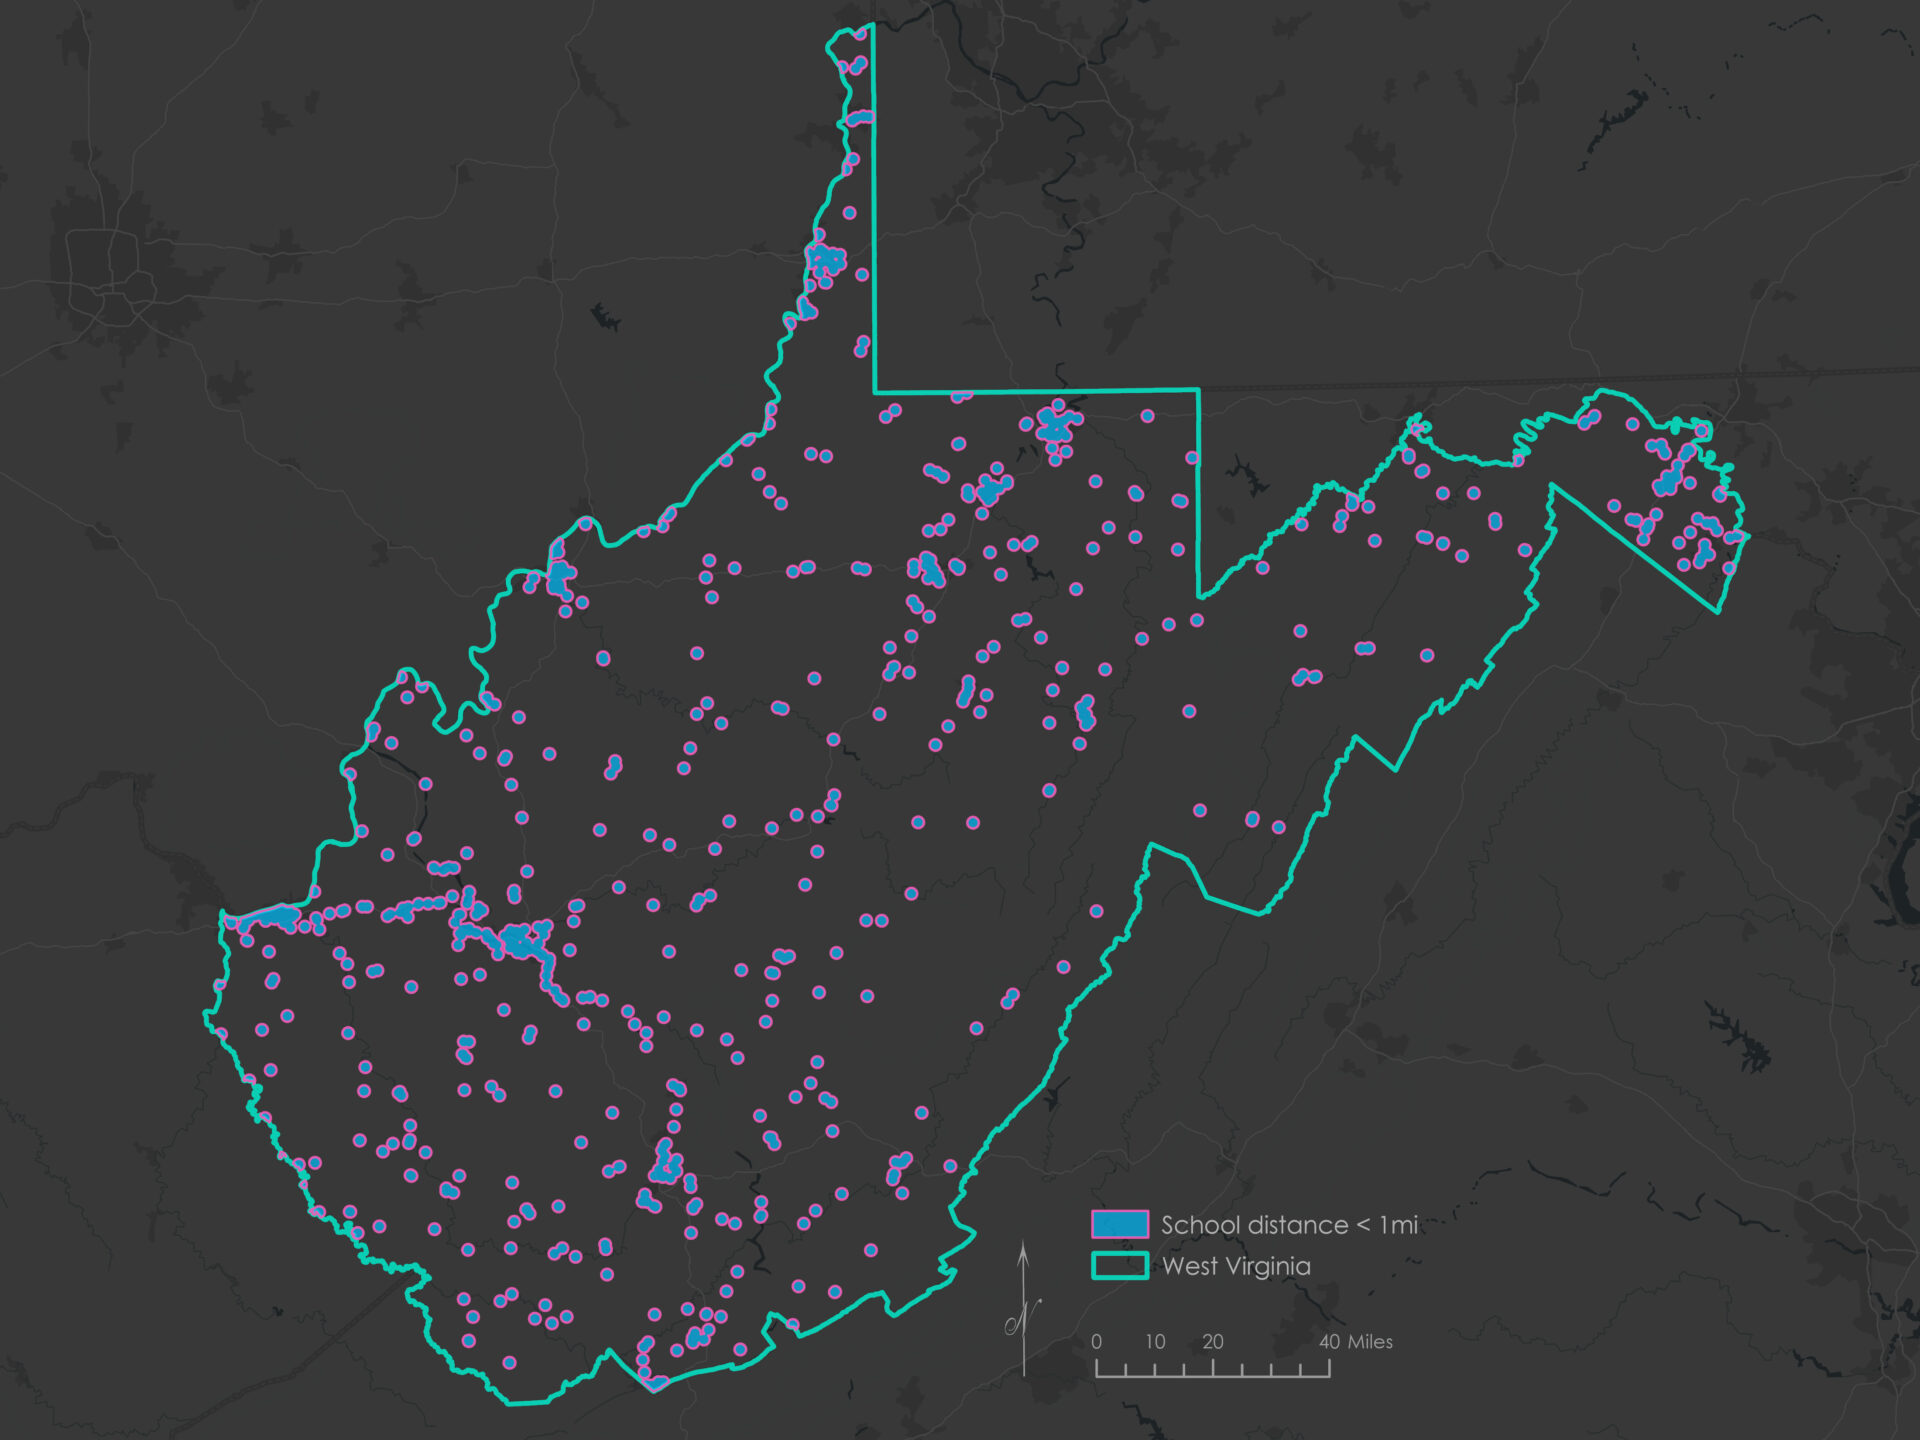
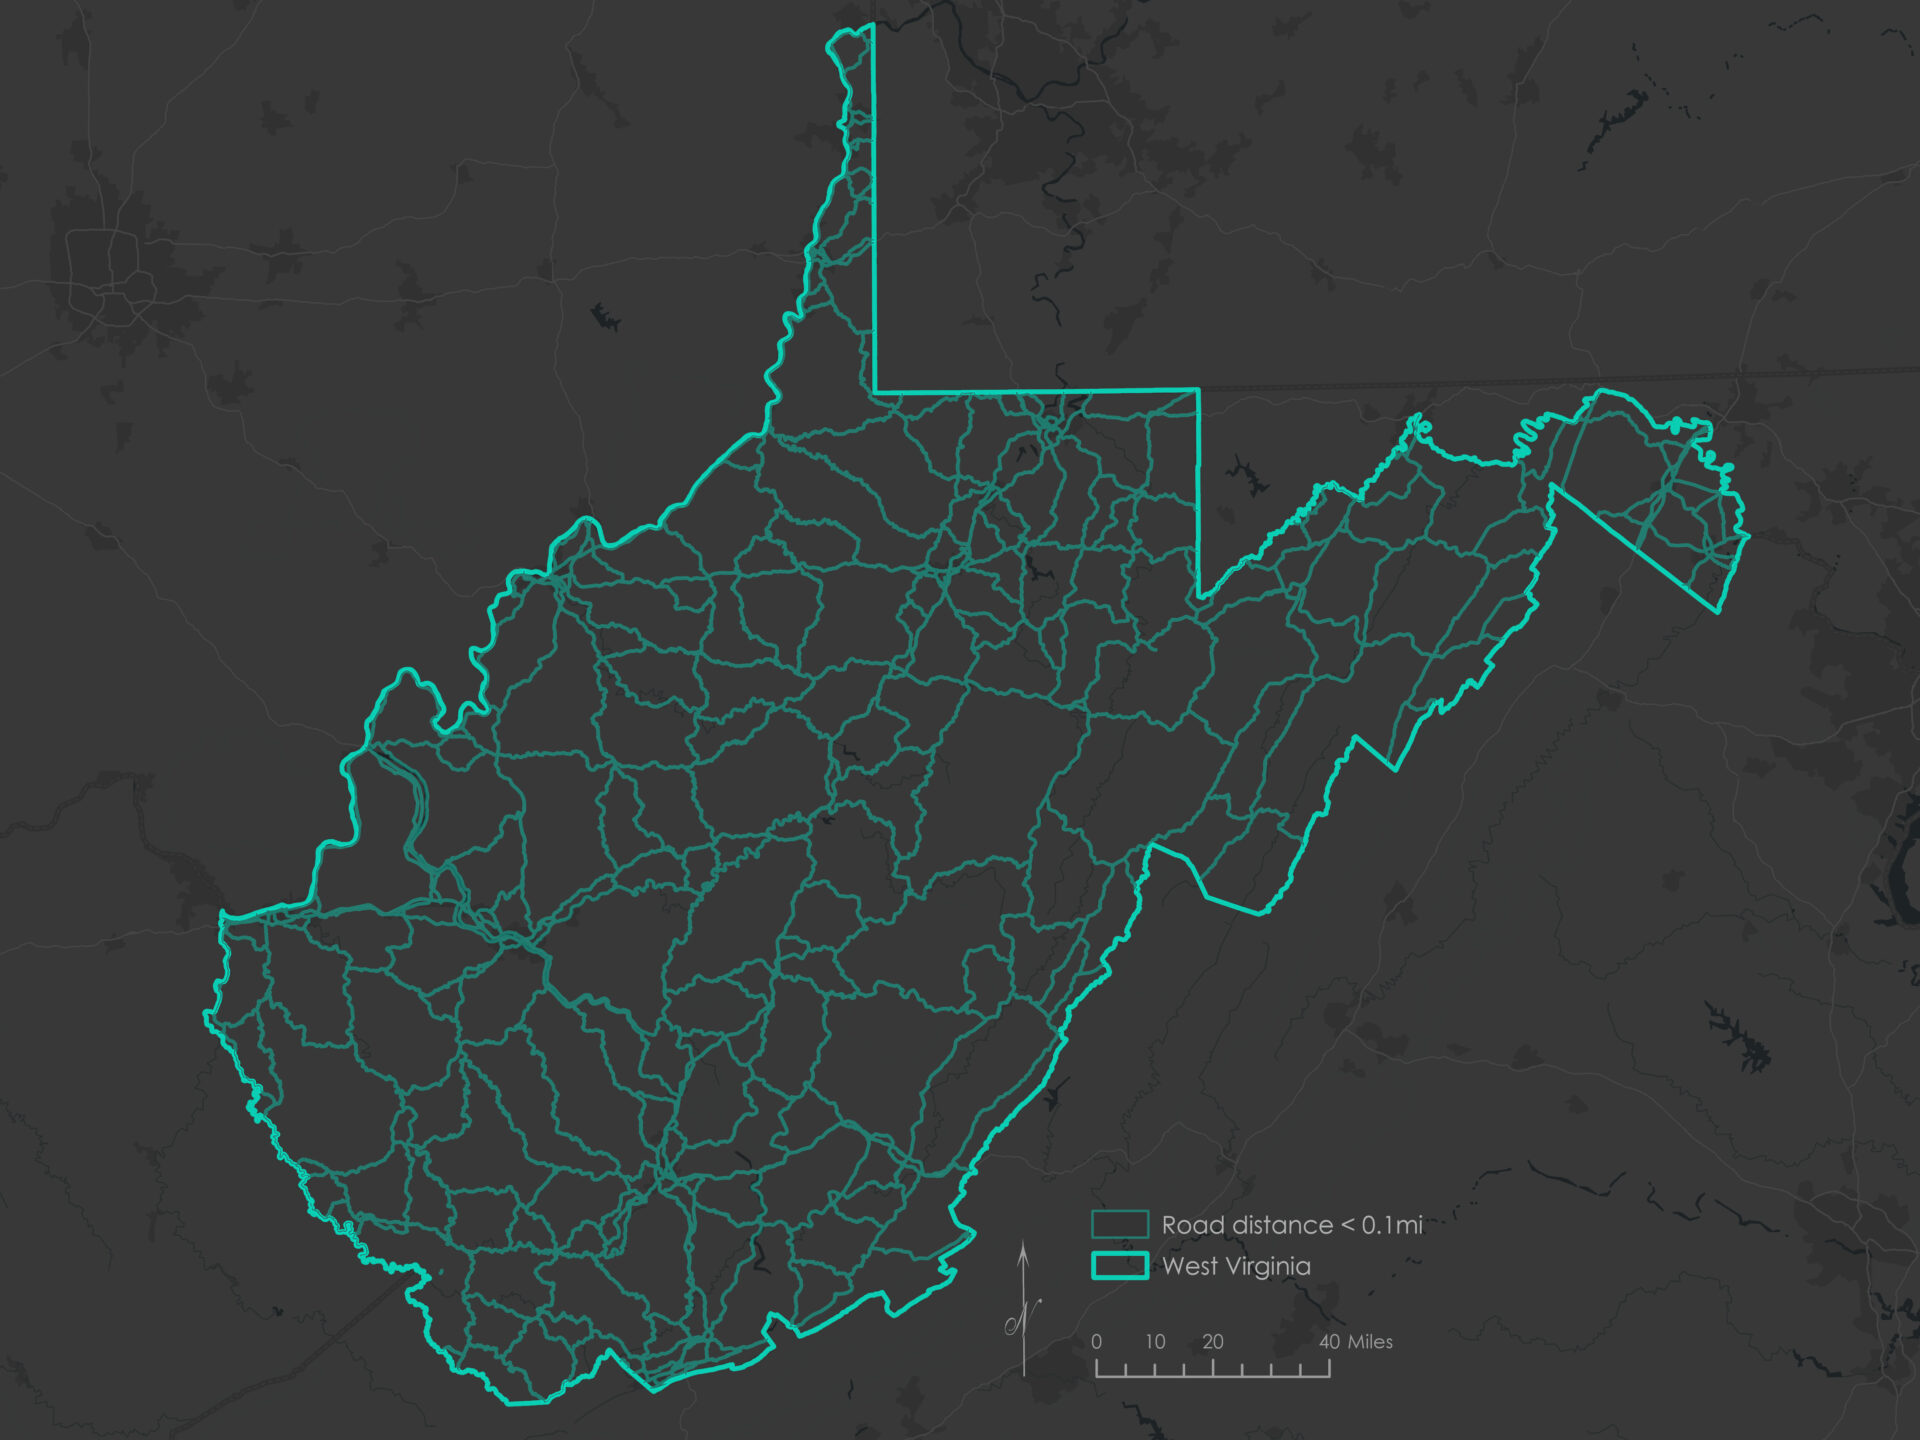
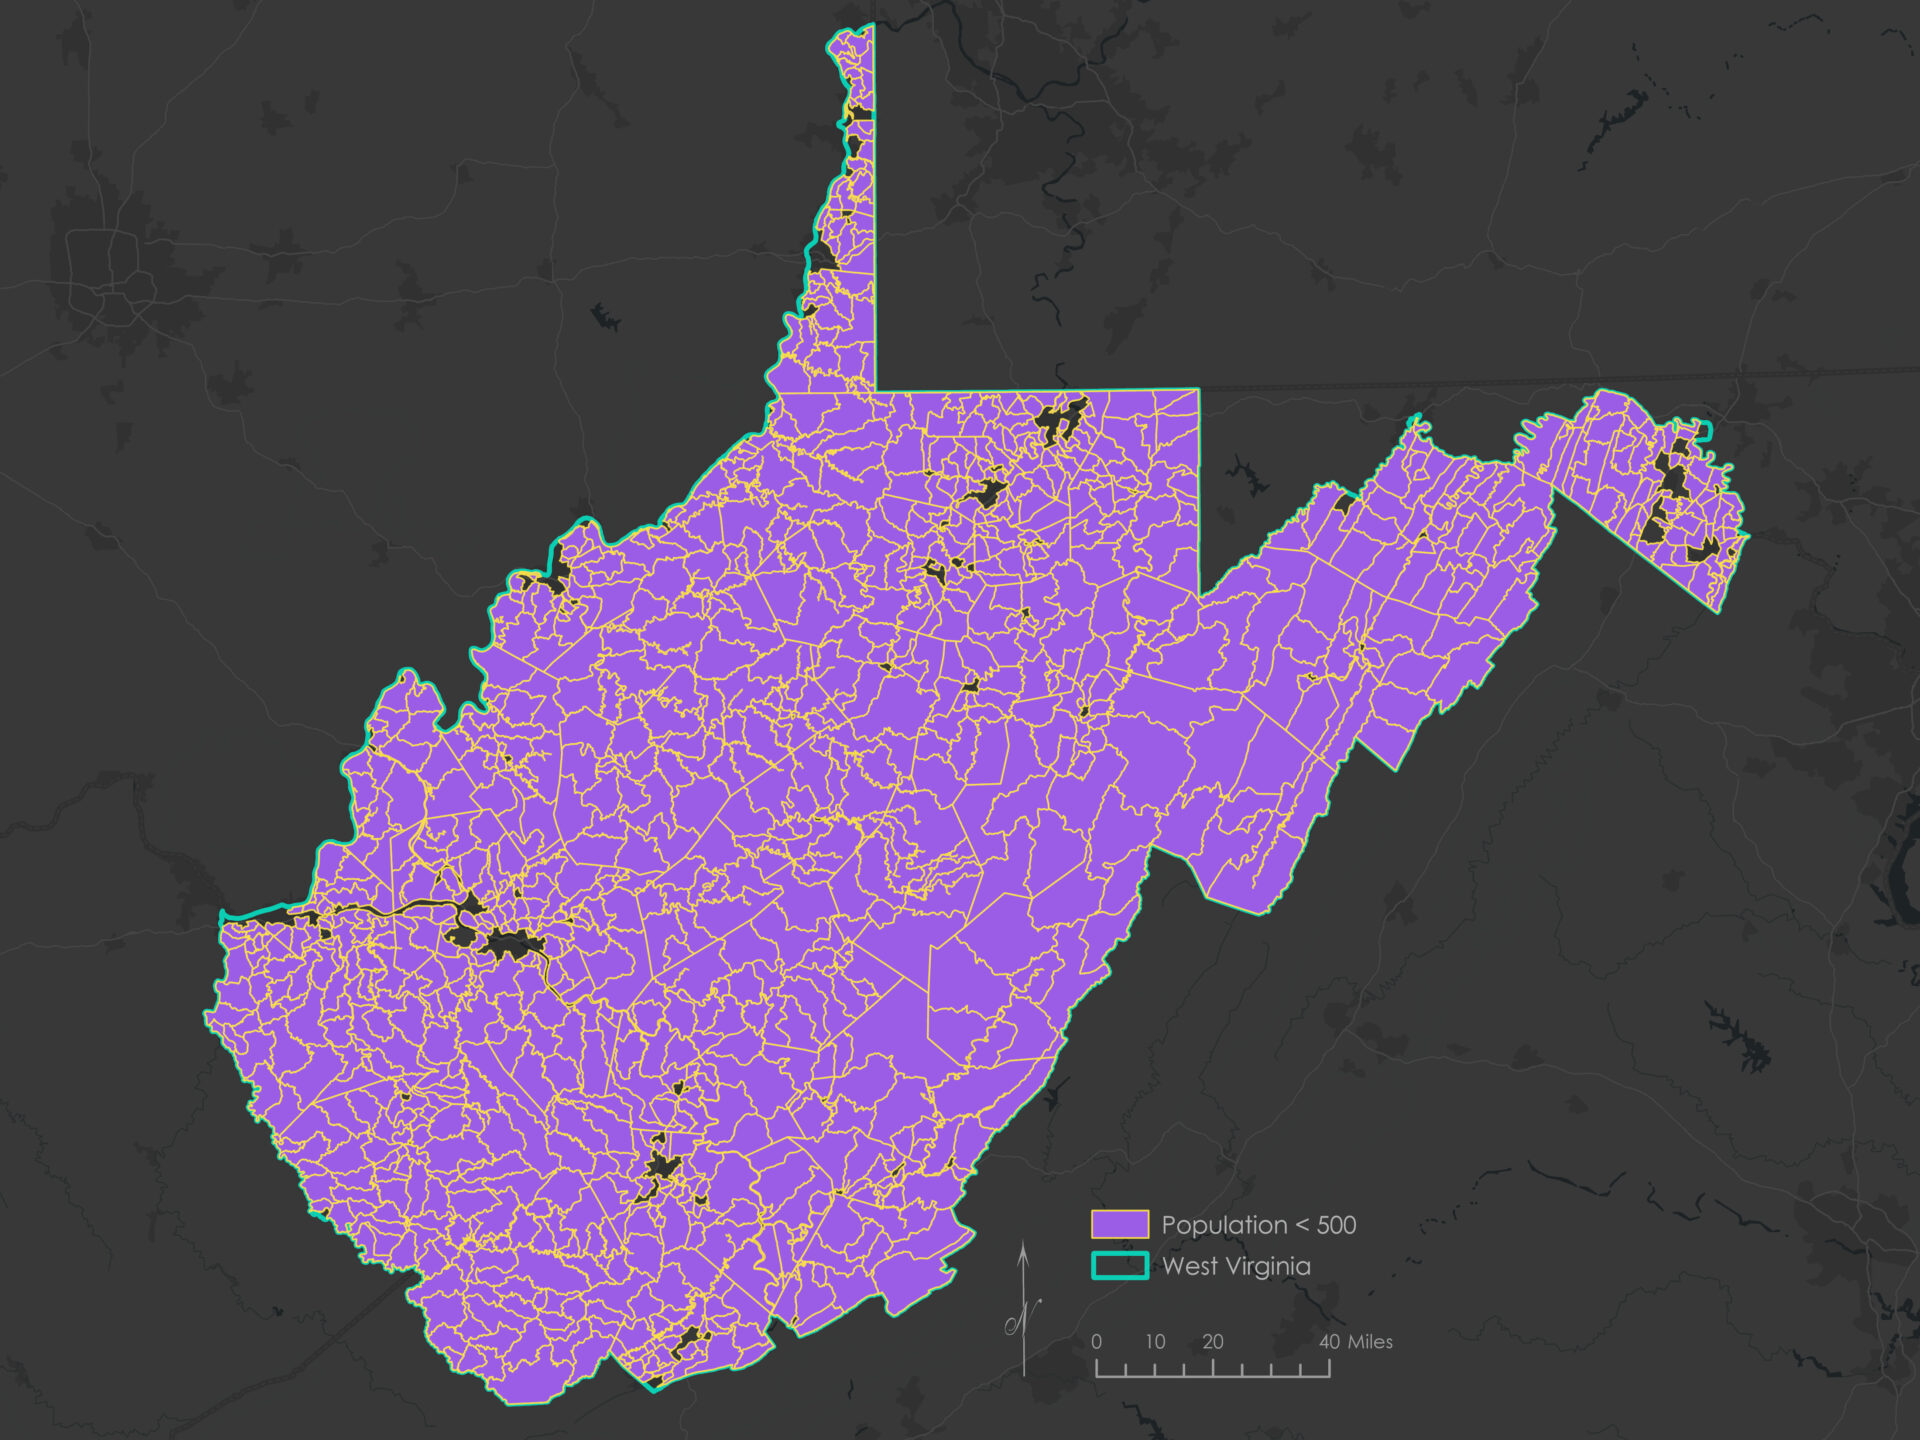
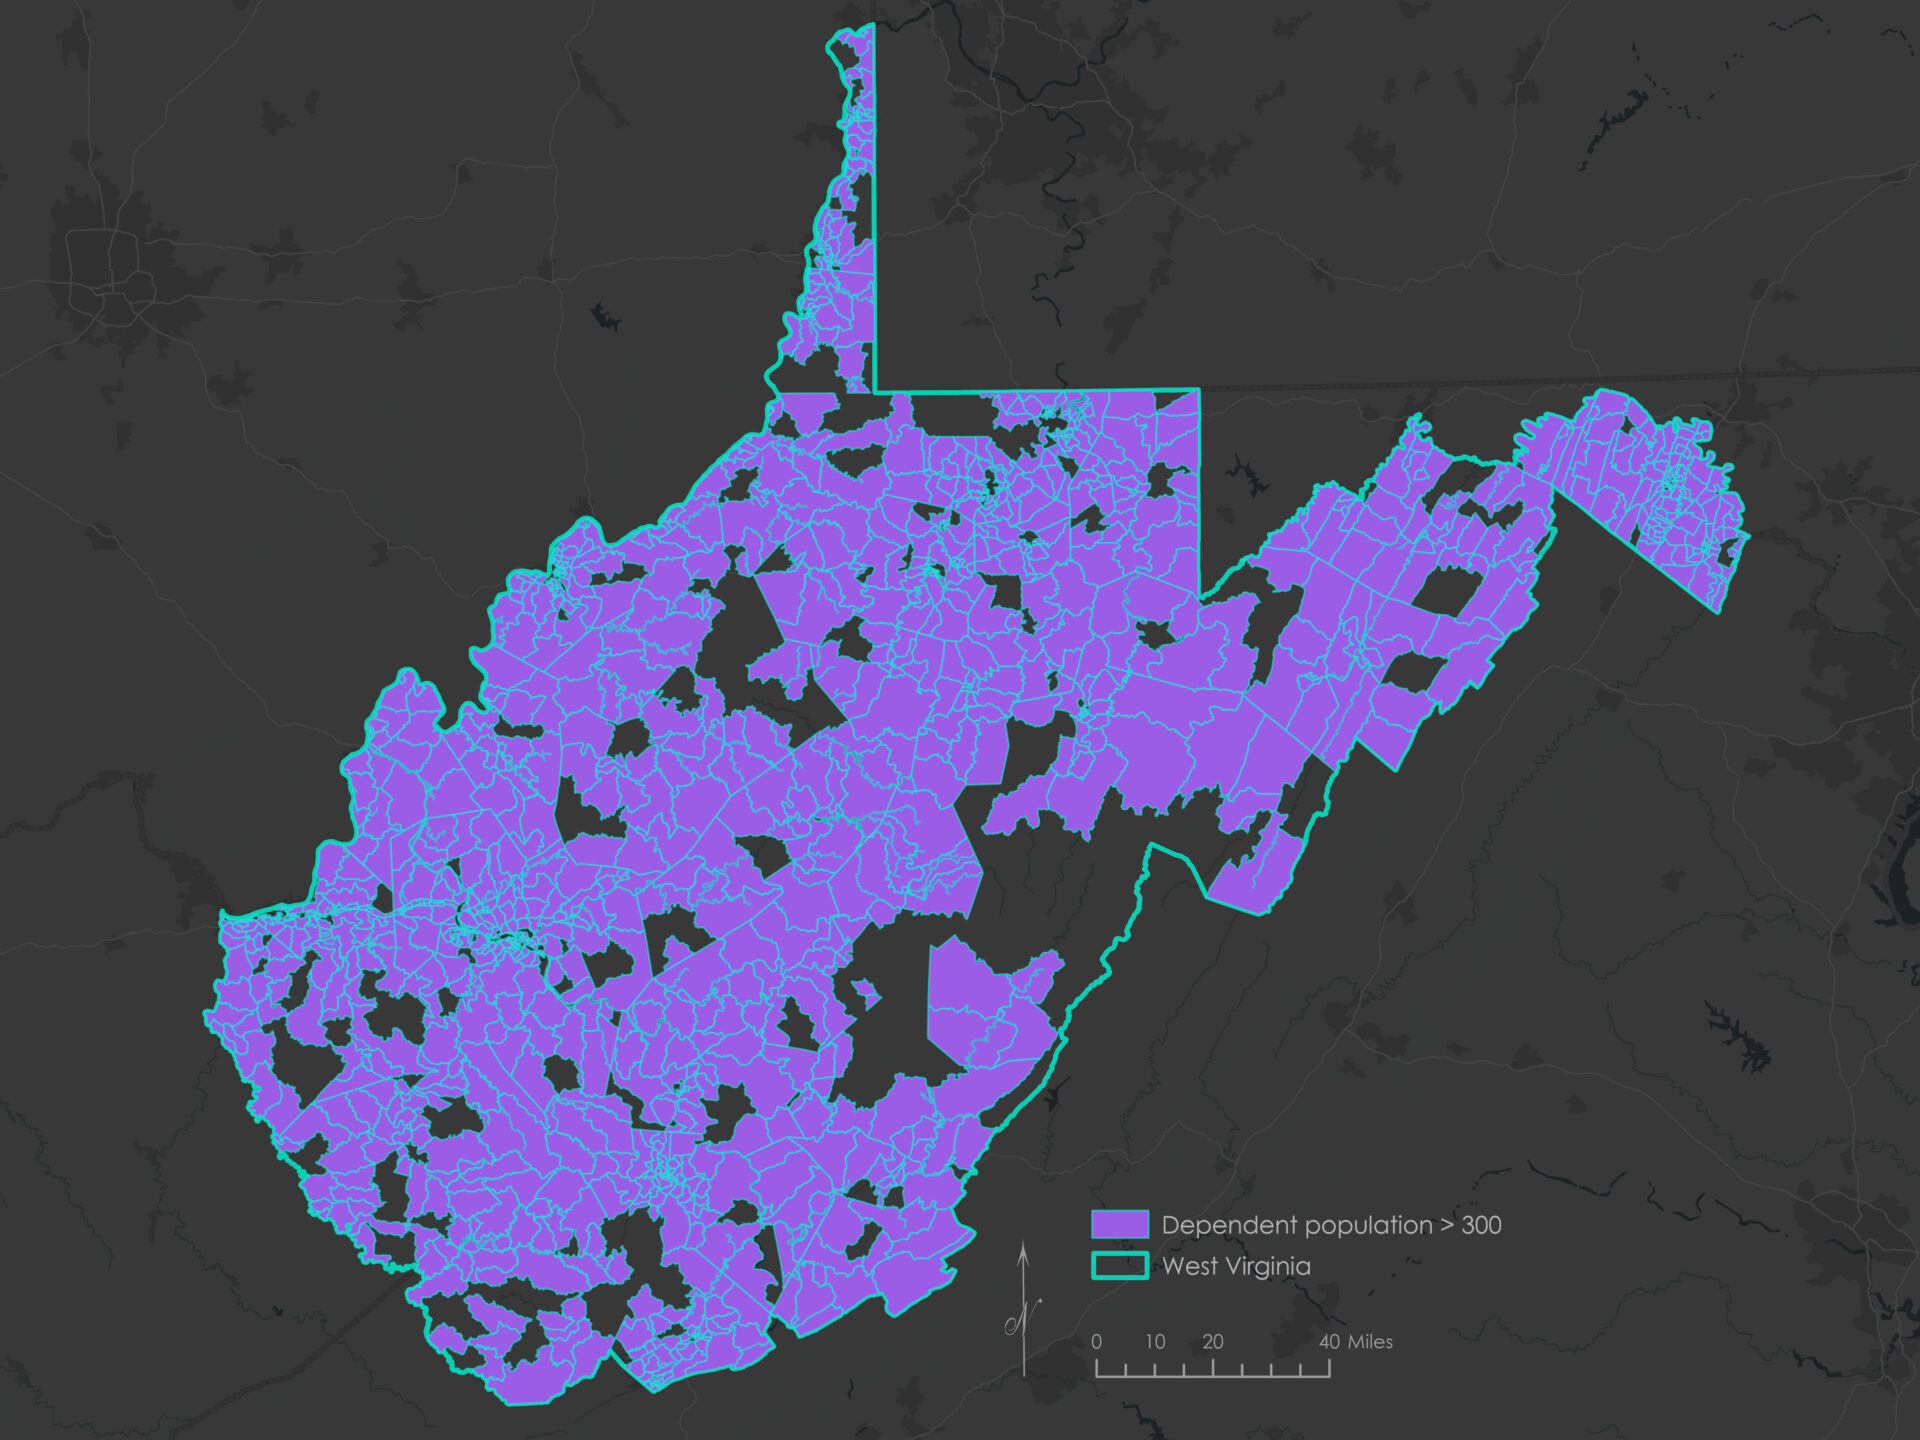
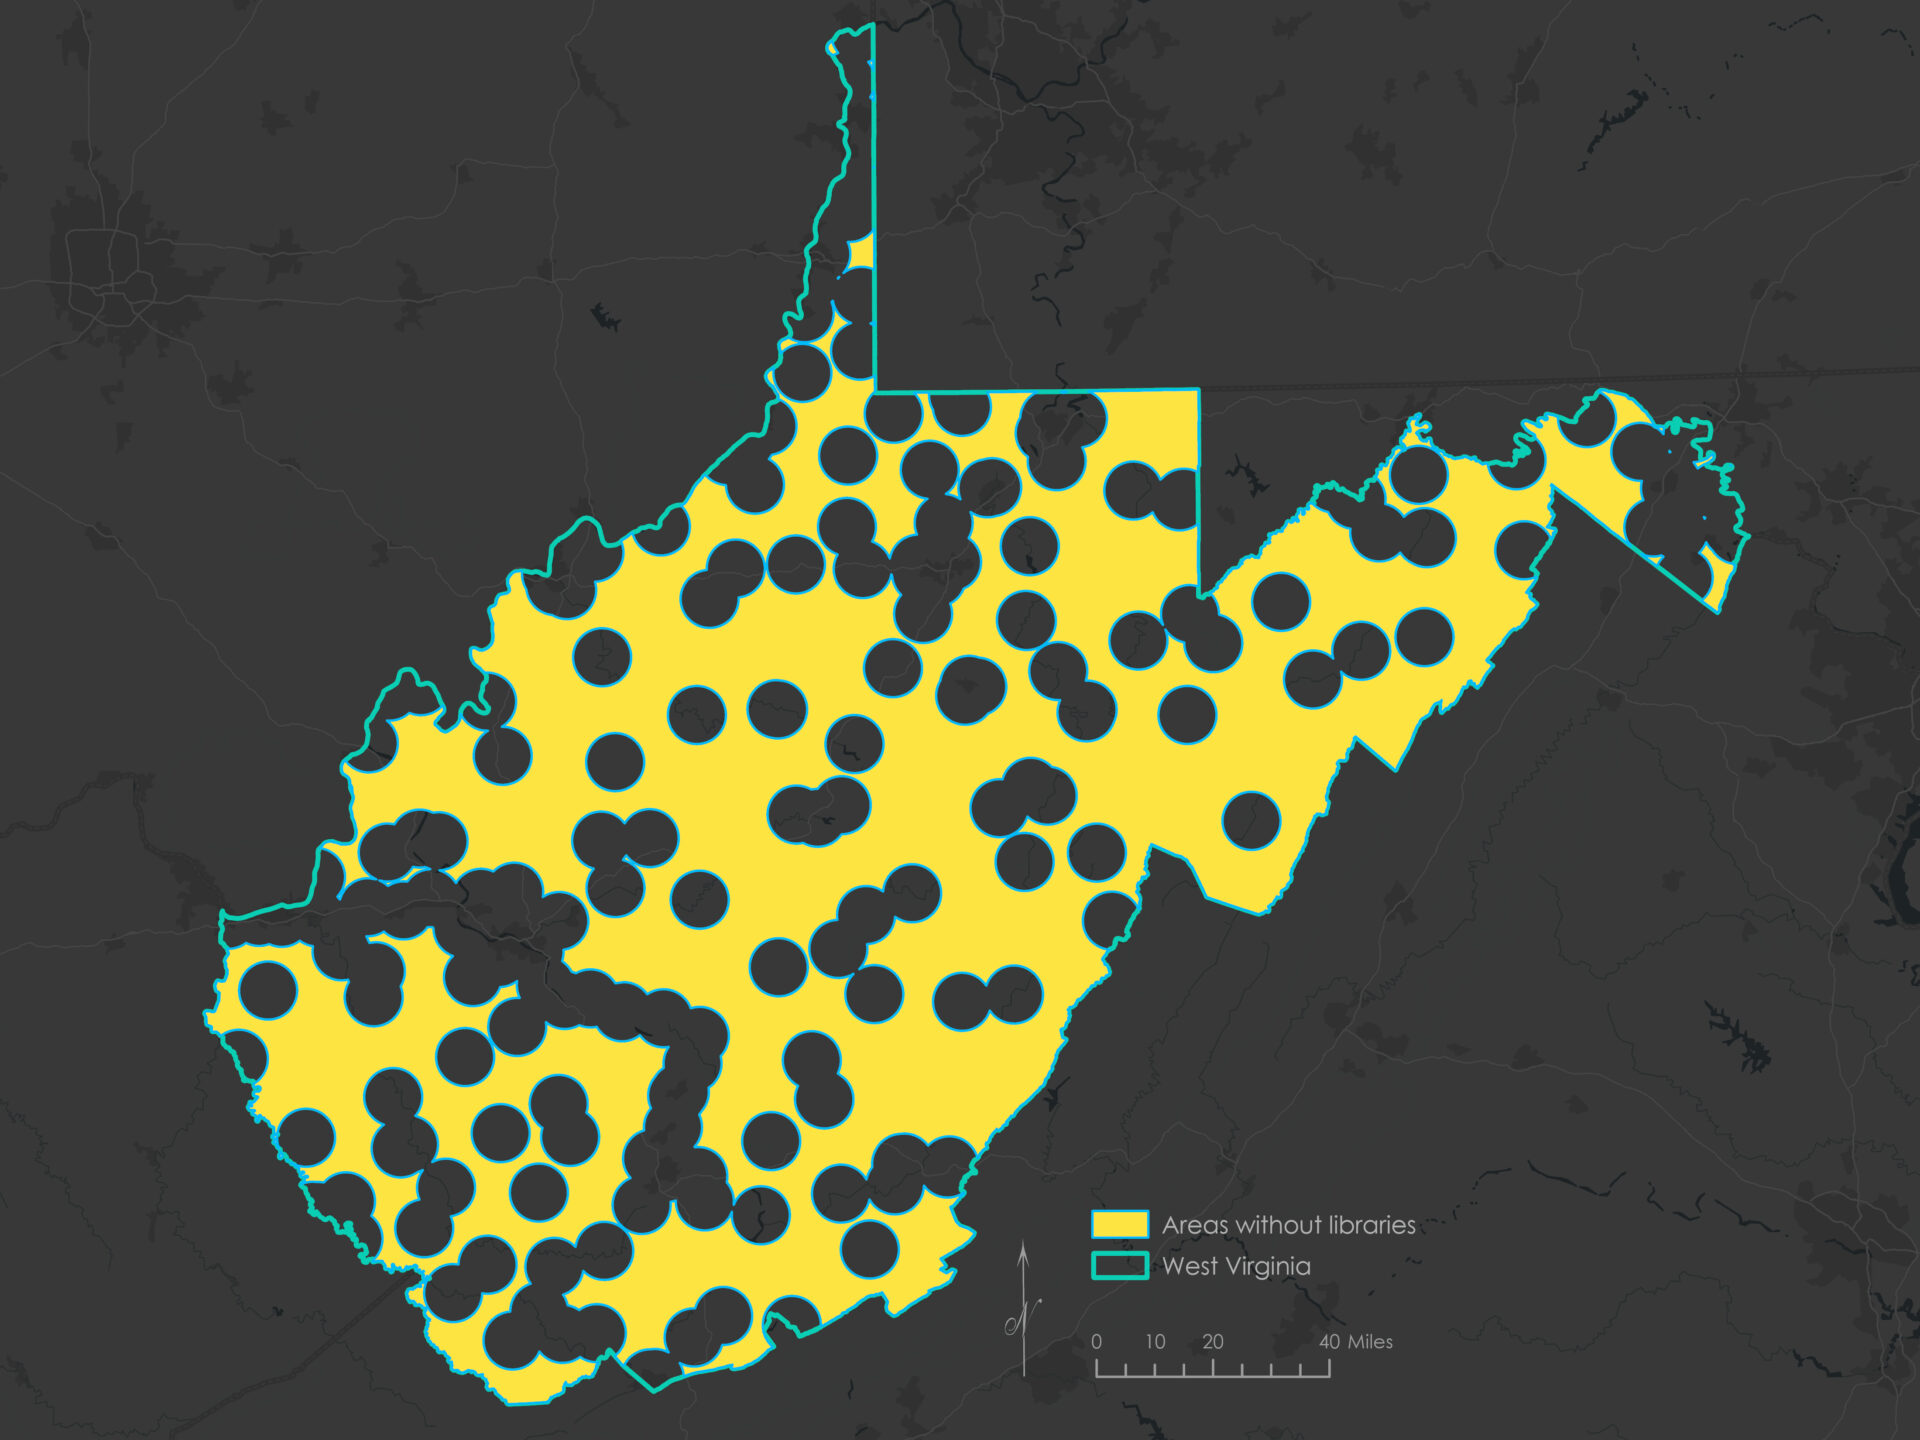
Individually, several criteria encompass broad portions of West Virginia. Requiring all five to overlap reduces that coverage substantially. The intersected polygons were converted to 168 representative points for mapping and comparison.
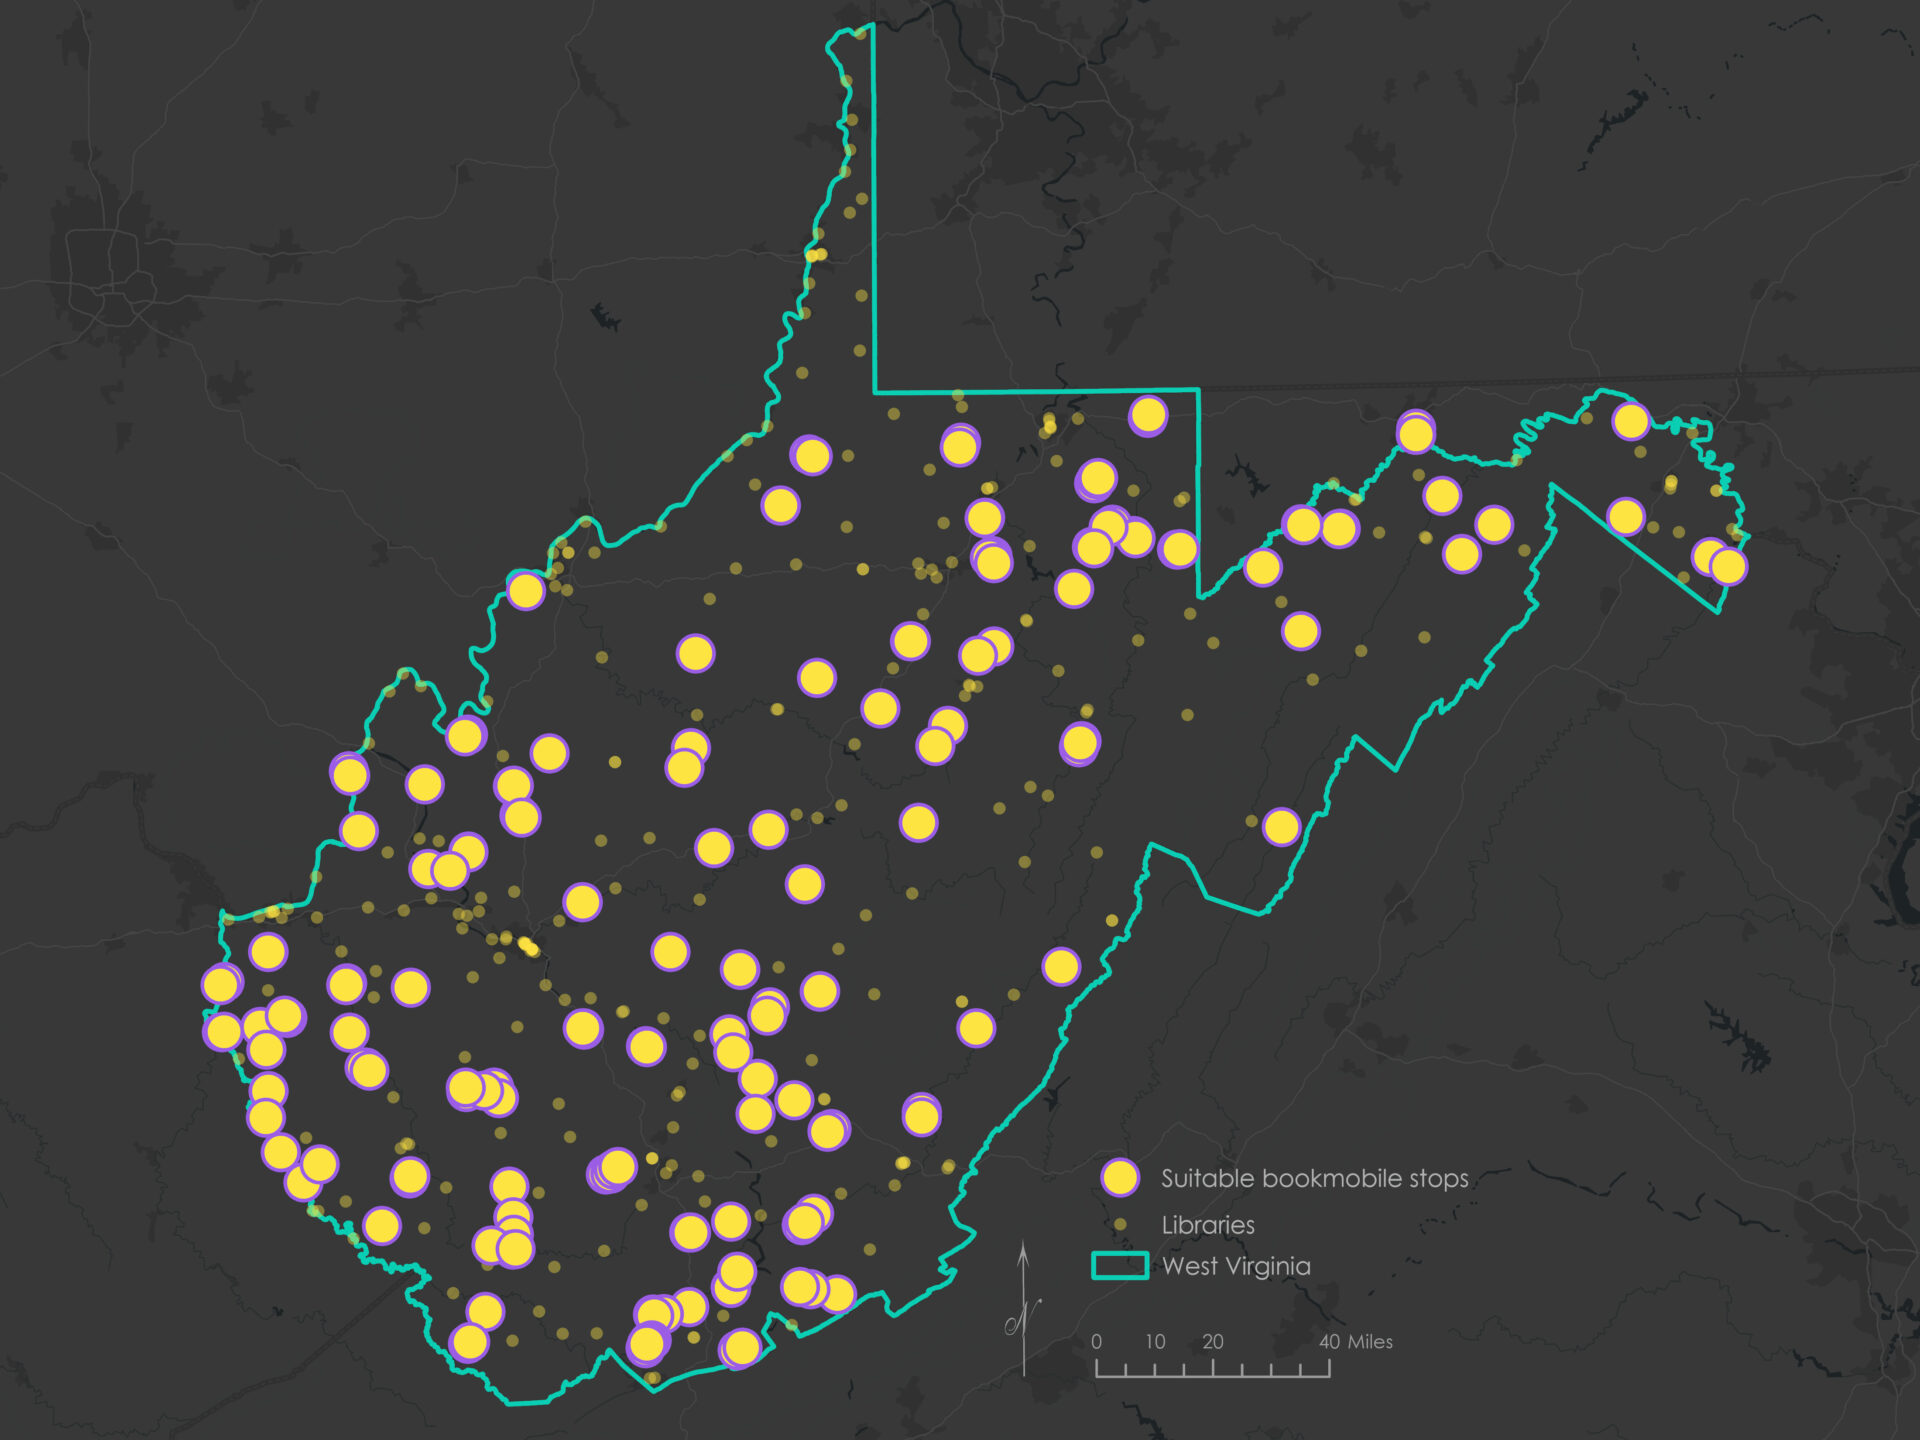
The result is deliberately strict. Every retained candidate has an uncomplicated explanation: it passed all five tests. The tradeoff is that near-misses disappear entirely, even when they perform well on the other four criteria.
Allowing tradeoffs between criteria
Weighted Linear Combination (WLC) replaces the Boolean model’s yes-or-no gates with a common scoring system. Each criterion was ranked from 1 to 4, with 1 representing the least suitable condition and 4 the most suitable. The ranks were then multiplied by weights representing their relative importance and added into one composite score.
This approach preserves more variation. An area with only moderate road access, for example, can remain competitive if it is far from a library and has a larger priority-age population. That flexibility also introduces judgment: the thresholds and weights directly influence the final pattern.
| Criterion | Weight | Scoring rule |
|---|---|---|
| Distance from libraries | 0.30 | 4: more than 4 mi 3: 3–4 mi 2: 2–3 mi 1: within 2 mi |
| Population under 18 or over 65 | 0.25 | 4: more than 300 3: 200–300 2: 100–199 1: fewer than 100 |
| Distance from major roads | 0.20 | 4: within 0.1 mi 3: 0.1–0.25 mi 2: 0.25–0.5 mi 1: more than 0.5 mi |
| Total block-group population | 0.15 | 4: fewer than 500 3: 500–599 2: 600–699 1: 700 or more |
| Distance from schools | 0.10 | 4: within 0.5 mi 3: 0.5–1 mi 2: 1–2 mi 1: more than 2 mi |
Distance criteria were divided into zones using multiple-ring buffers, while the two population criteria were classified from Census attributes. Calculate Field assigned the corresponding rank to each feature. For example, the priority-age population was reclassified with:
def Reclass(pop):
    if pop > 300:
        return 4
    elif 200 <= pop <= 300:
        return 3
    elif 100 <= pop < 200:
        return 2
    else:
        return 1
The remaining criteria followed the same 1–4 ranking pattern. ModelBuilder then combined the five vector layers so that each resulting polygon carried all five scores.
Reading the five rankings
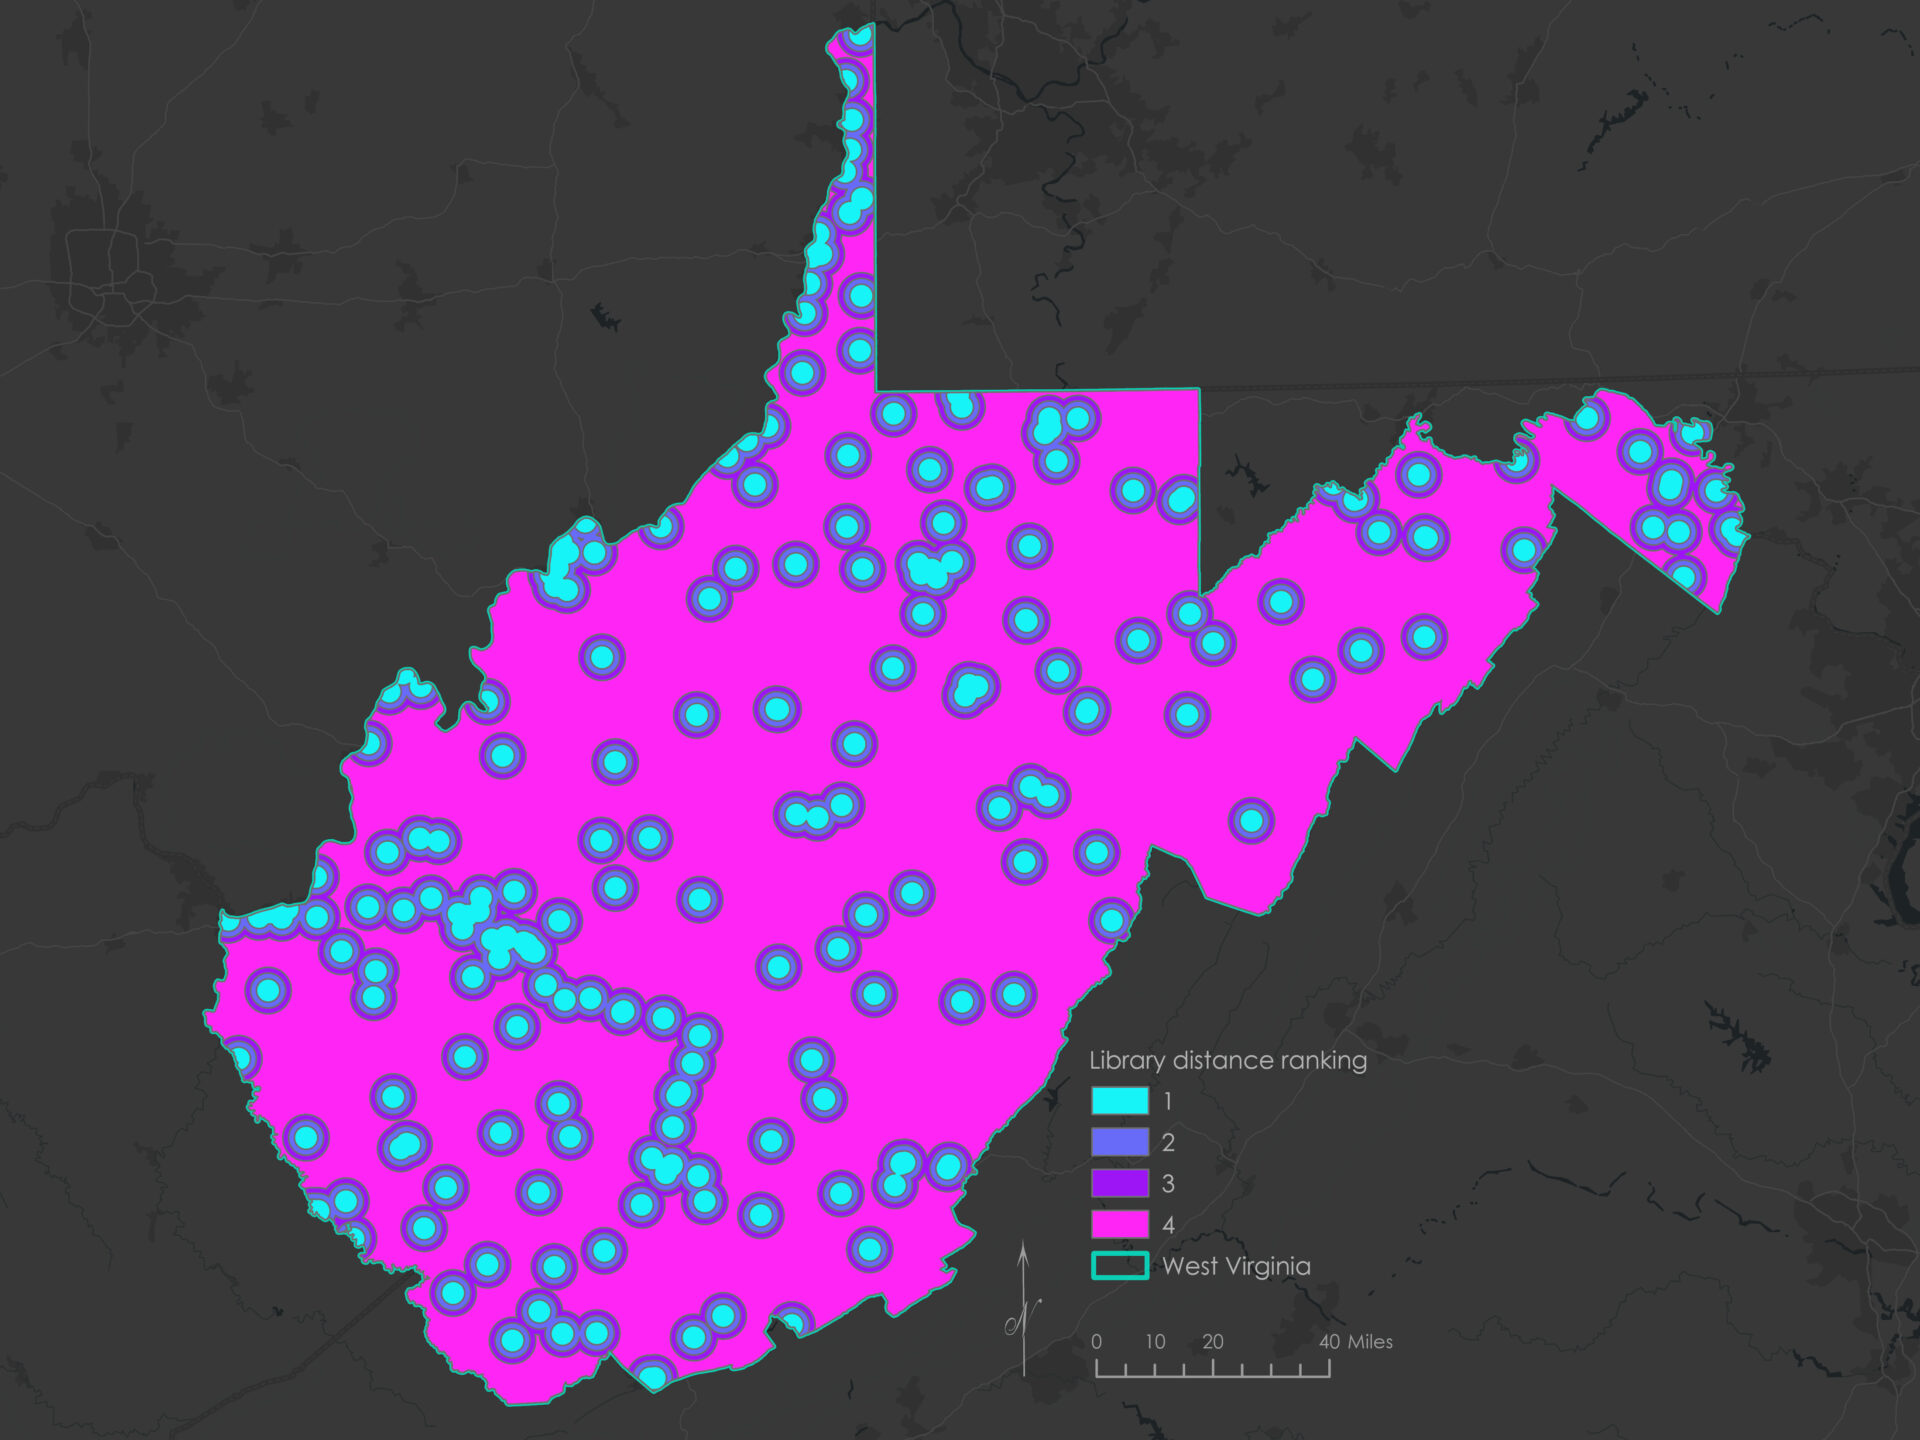
Distance from libraries
The most heavily weighted criterion favored areas farther from an existing public library. Areas outside the four-mile buffer received the highest rank, while locations within two miles received the lowest.
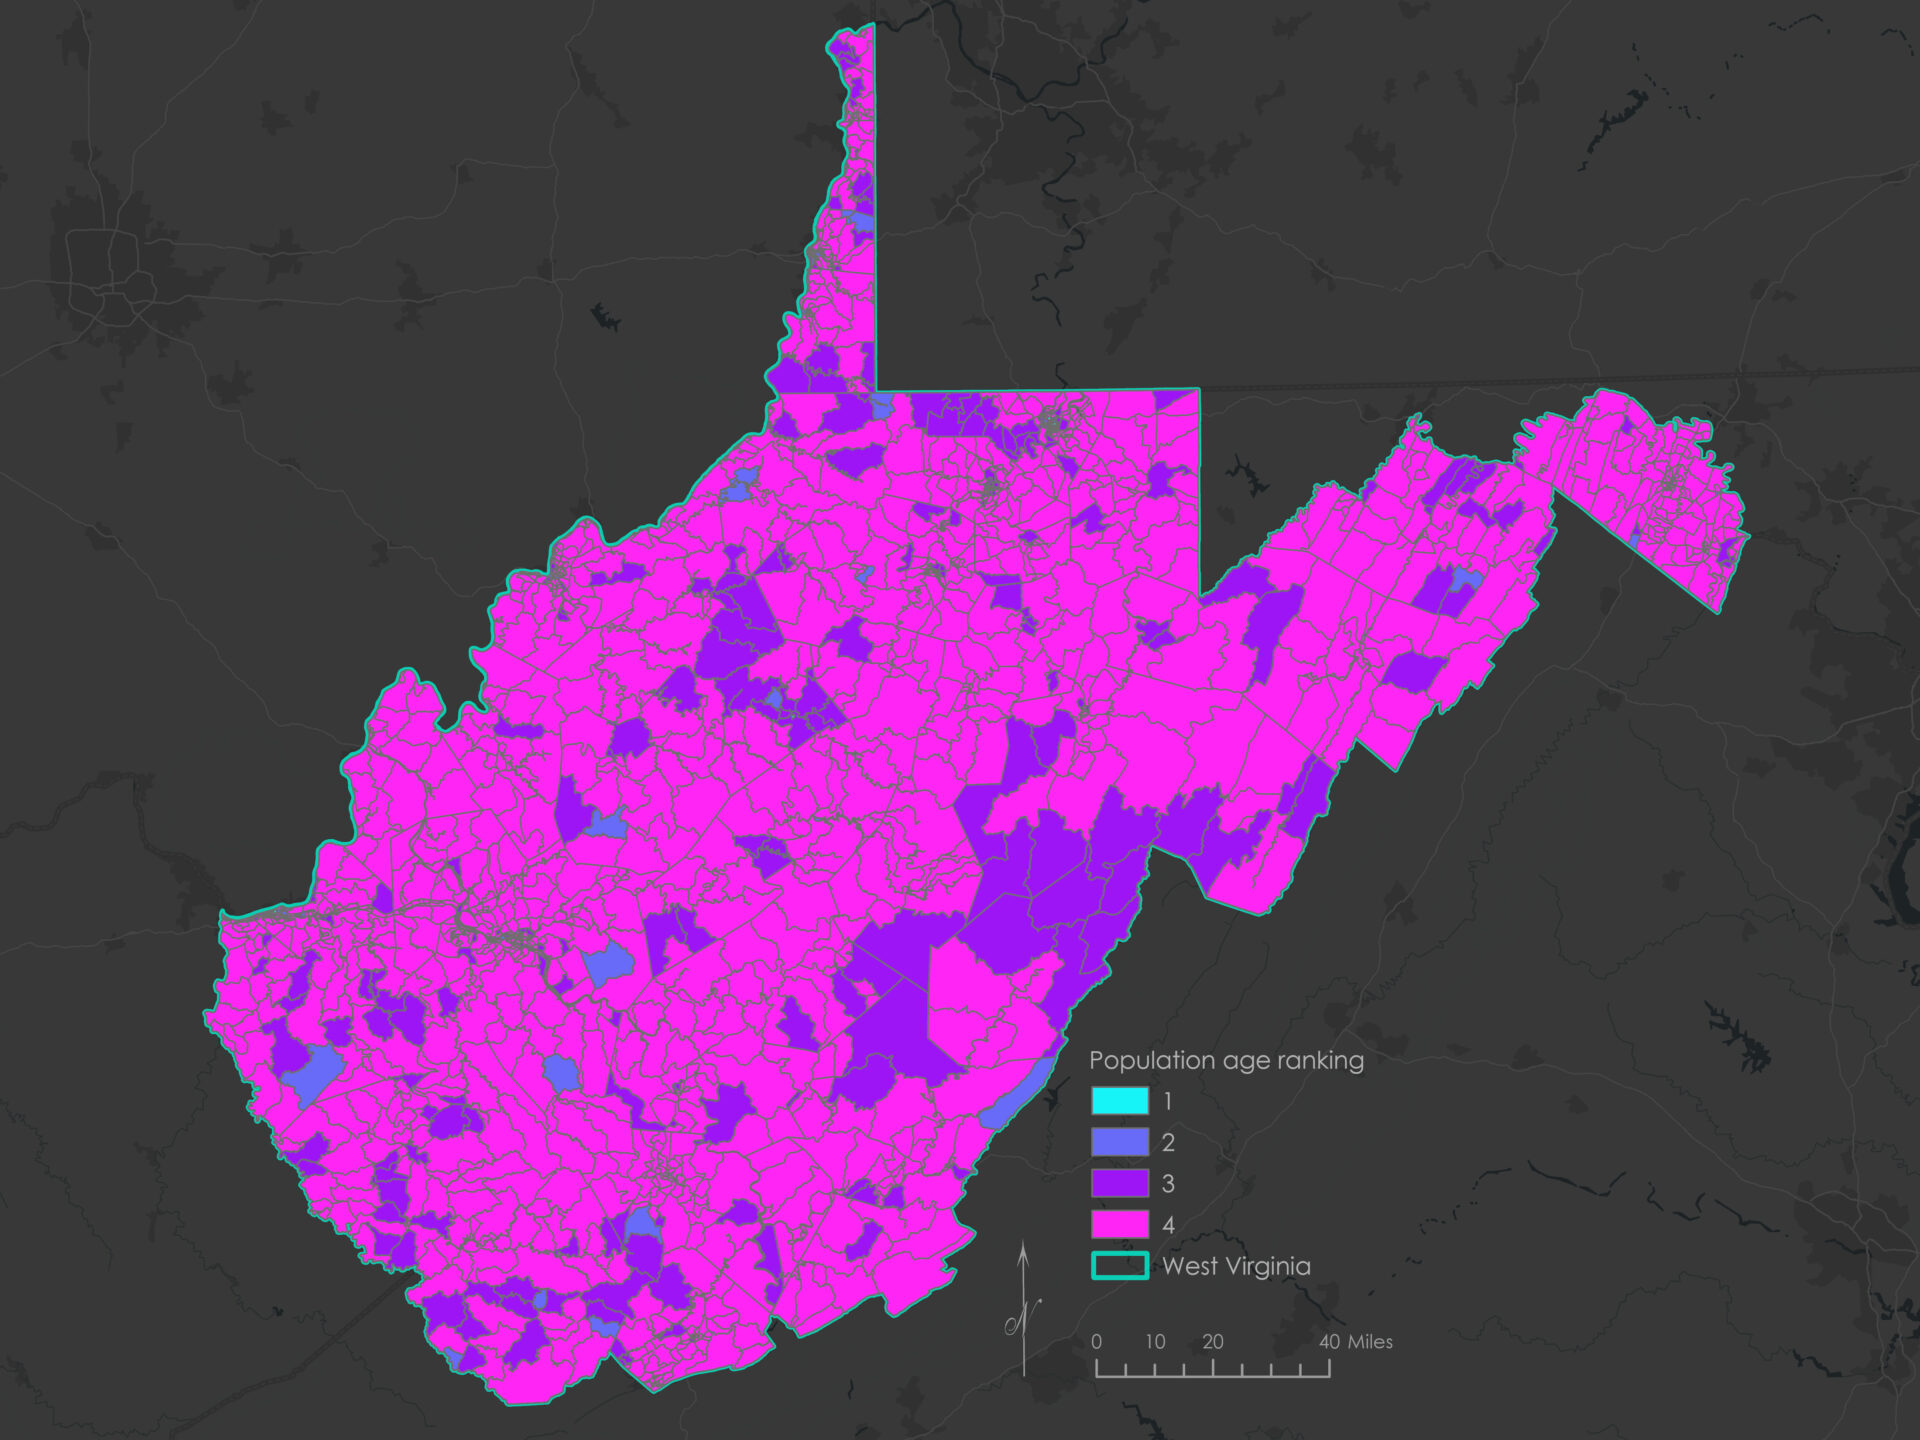
Priority-age population
The second-largest weight favored census block groups with larger combined populations of residents under 18 or over 65. This criterion directed the model toward areas where a mobile service might reach more children, families, and older adults.
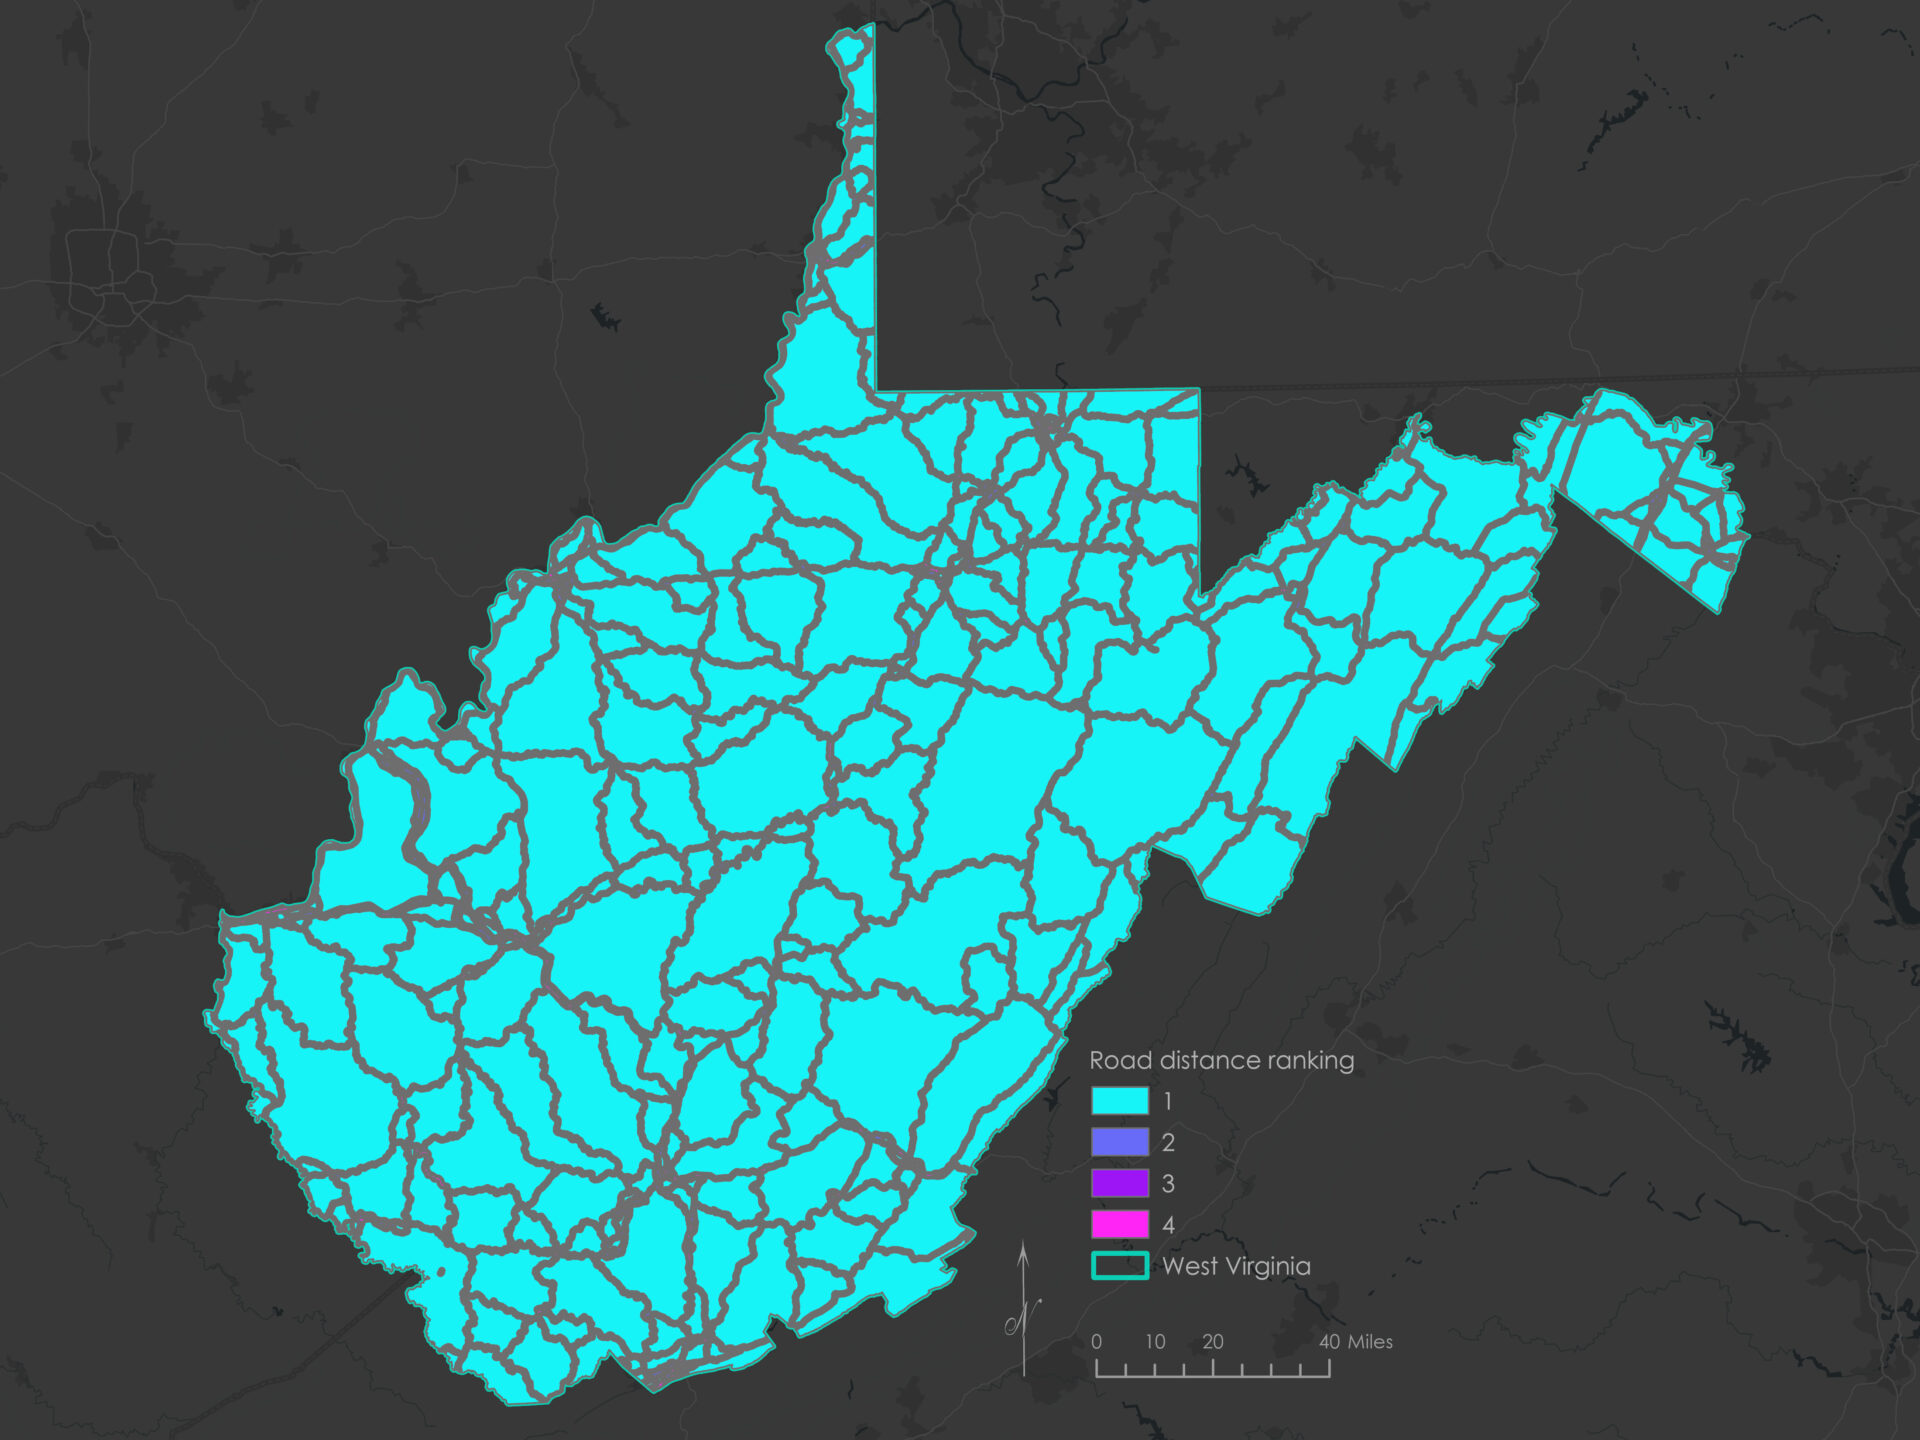
Distance from roads
Proximity to primary and secondary roads represented operational accessibility. The highest scores follow the road corridors closely, while areas more than half a mile away received the lowest rank.
Total population
Smaller block-group populations received higher scores to retain the project’s rural-service emphasis. Unlike the Boolean threshold, WLC preserved intermediate population ranges rather than immediately discarding every block group with 500 or more residents.

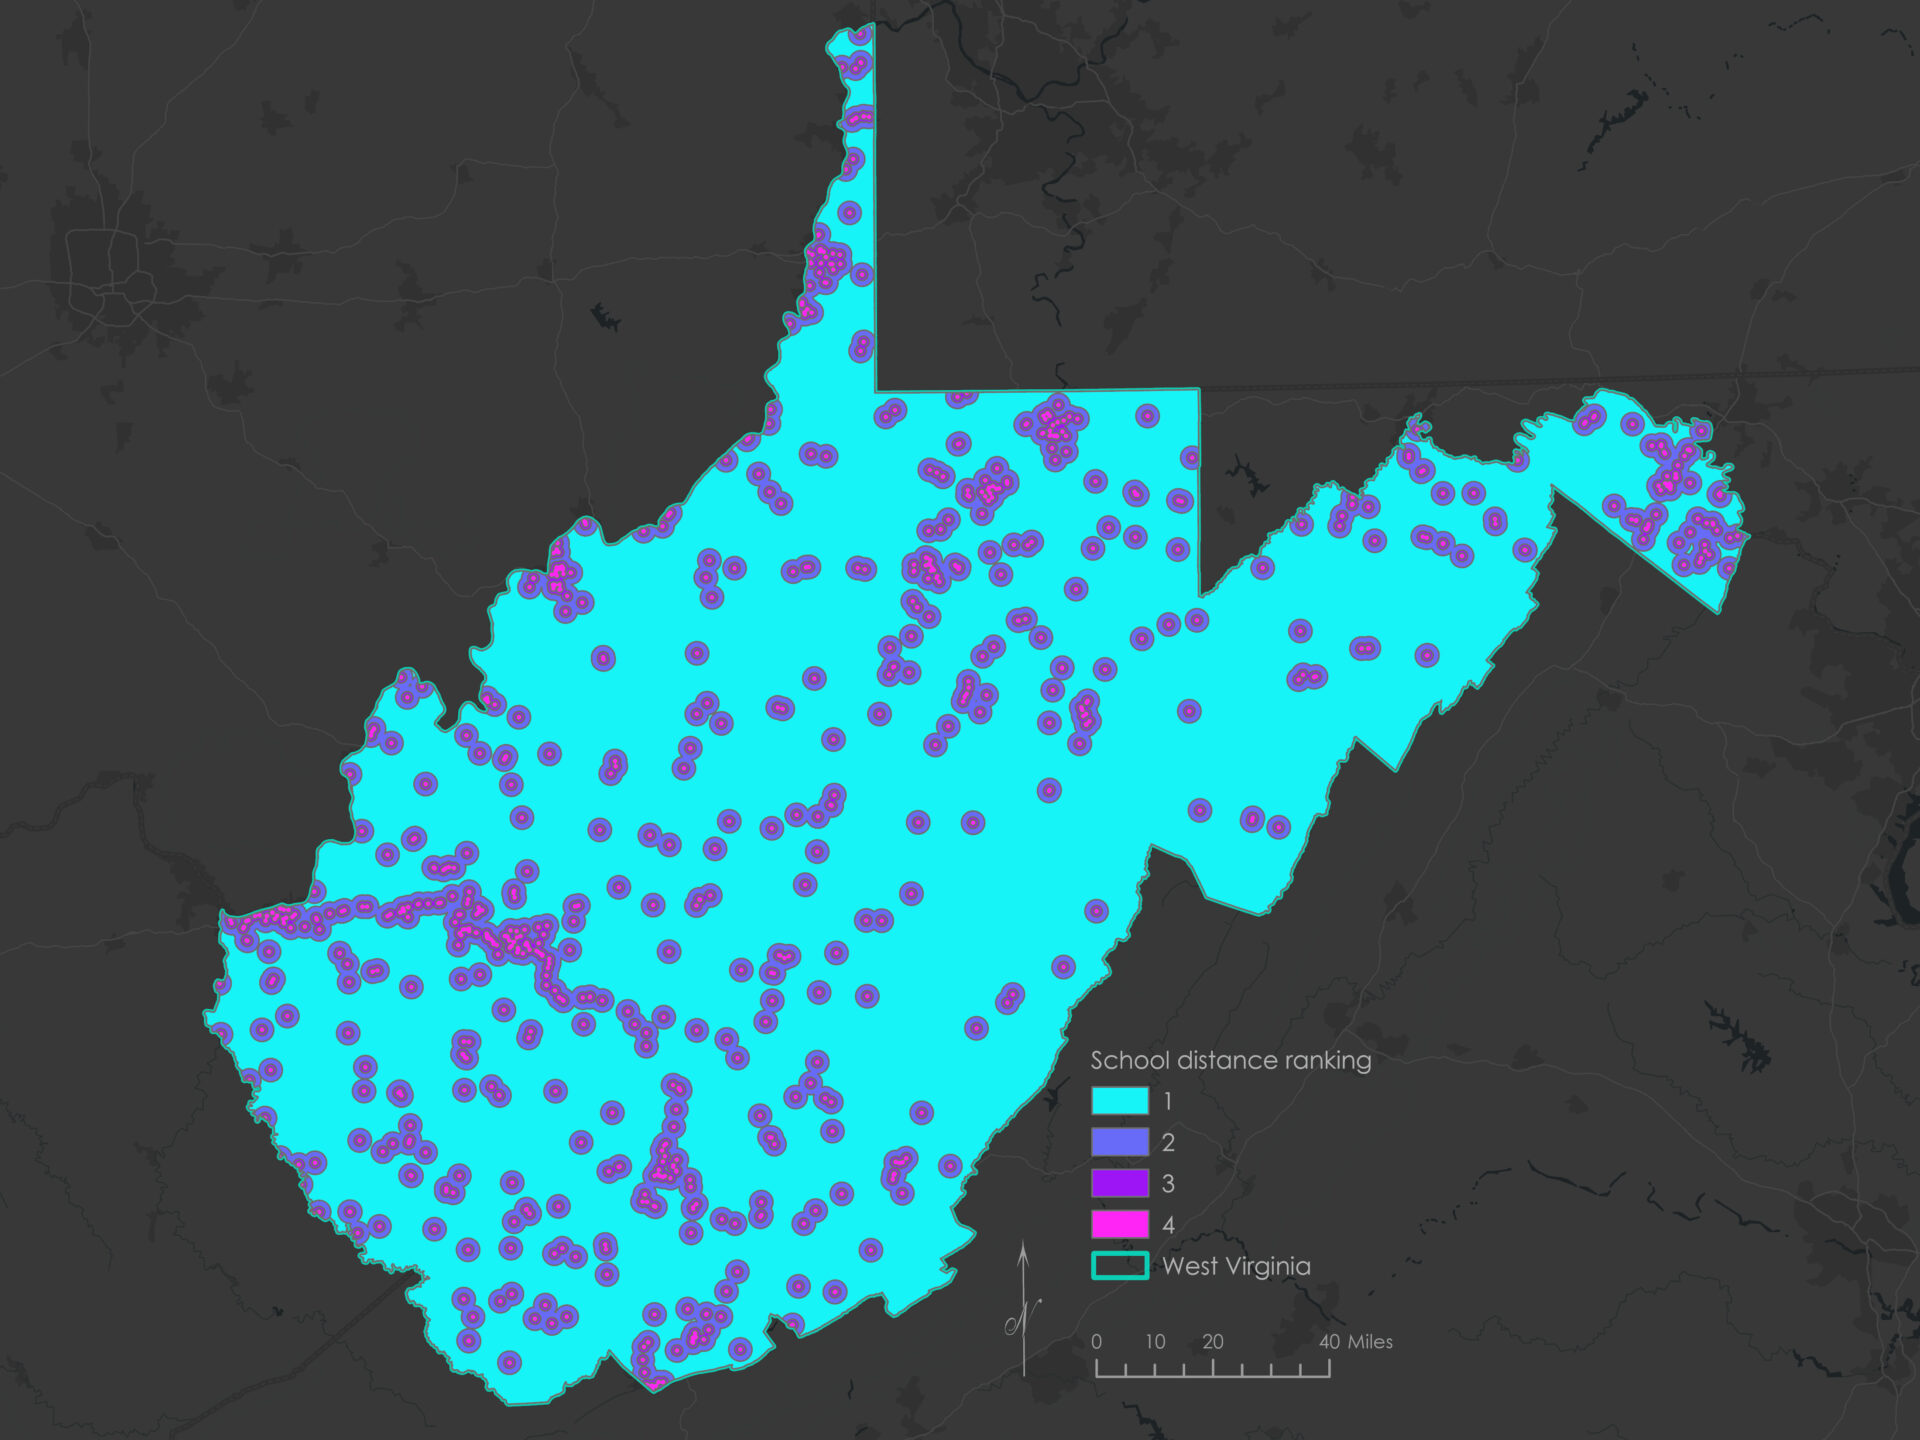
Distance from schools
Schools were treated as potential community anchors. Areas within half a mile received the highest score, with suitability declining across the one- and two-mile distance bands.
Combining the scores
After the five ranking layers were combined, the final suitability score was calculated using:
(0.30 * !rankLibraries!) +
(0.25 * !rankAgePop!) +
(0.20 * !rankRoads!) +
(0.15 * !rankPop!) +
(0.10 * !rankSchools!)
The resulting vector layer is visually dense because every buffer boundary and census block-group boundary creates additional geometry. Each piece, however small, carries the five underlying ranks and their combined score.
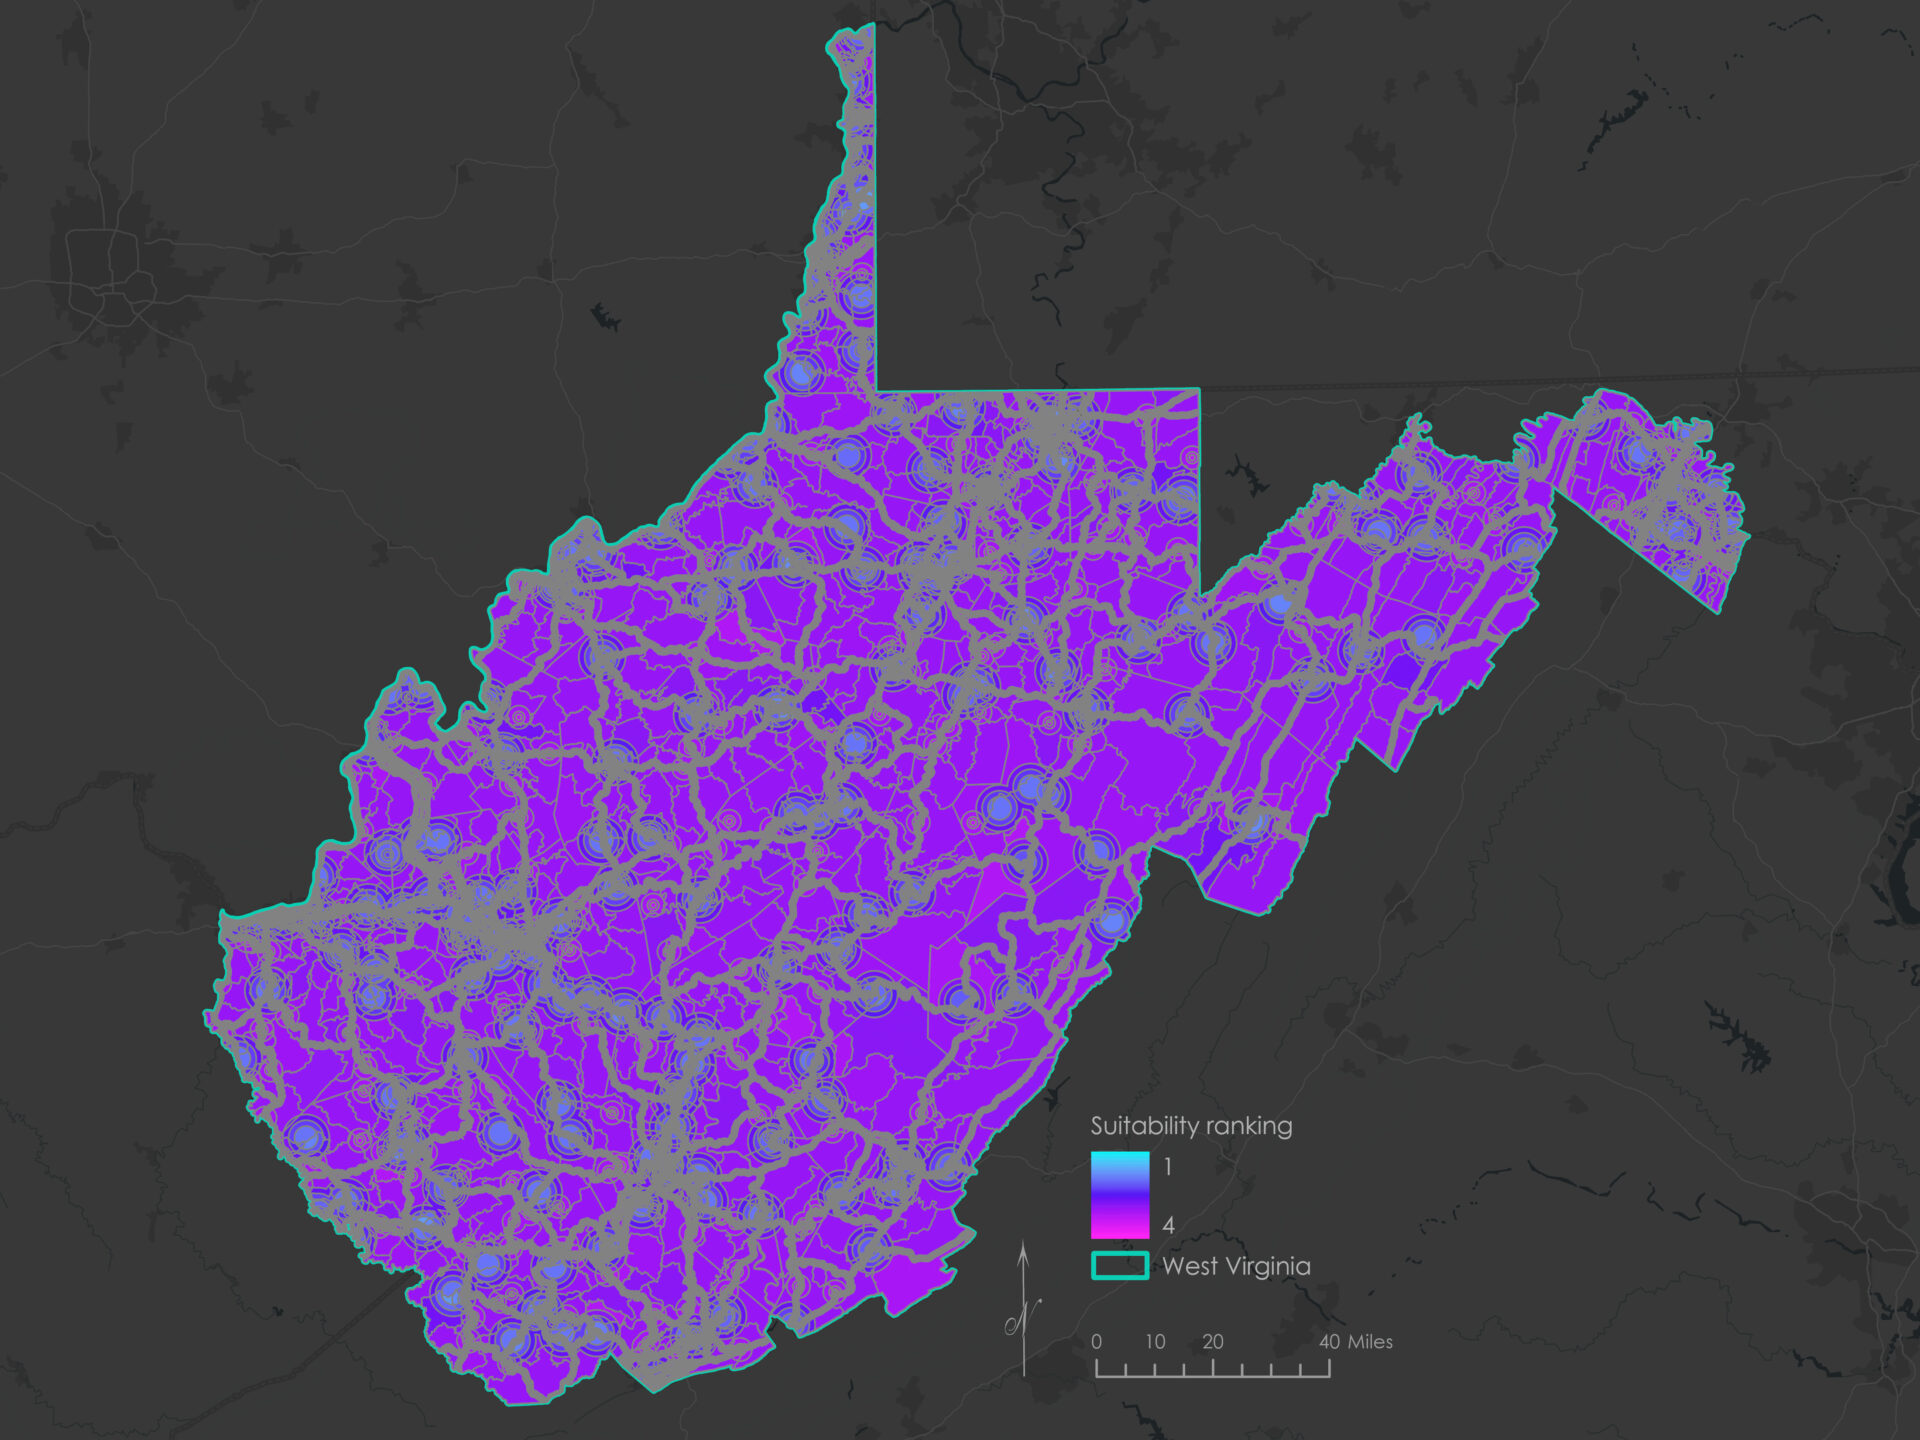
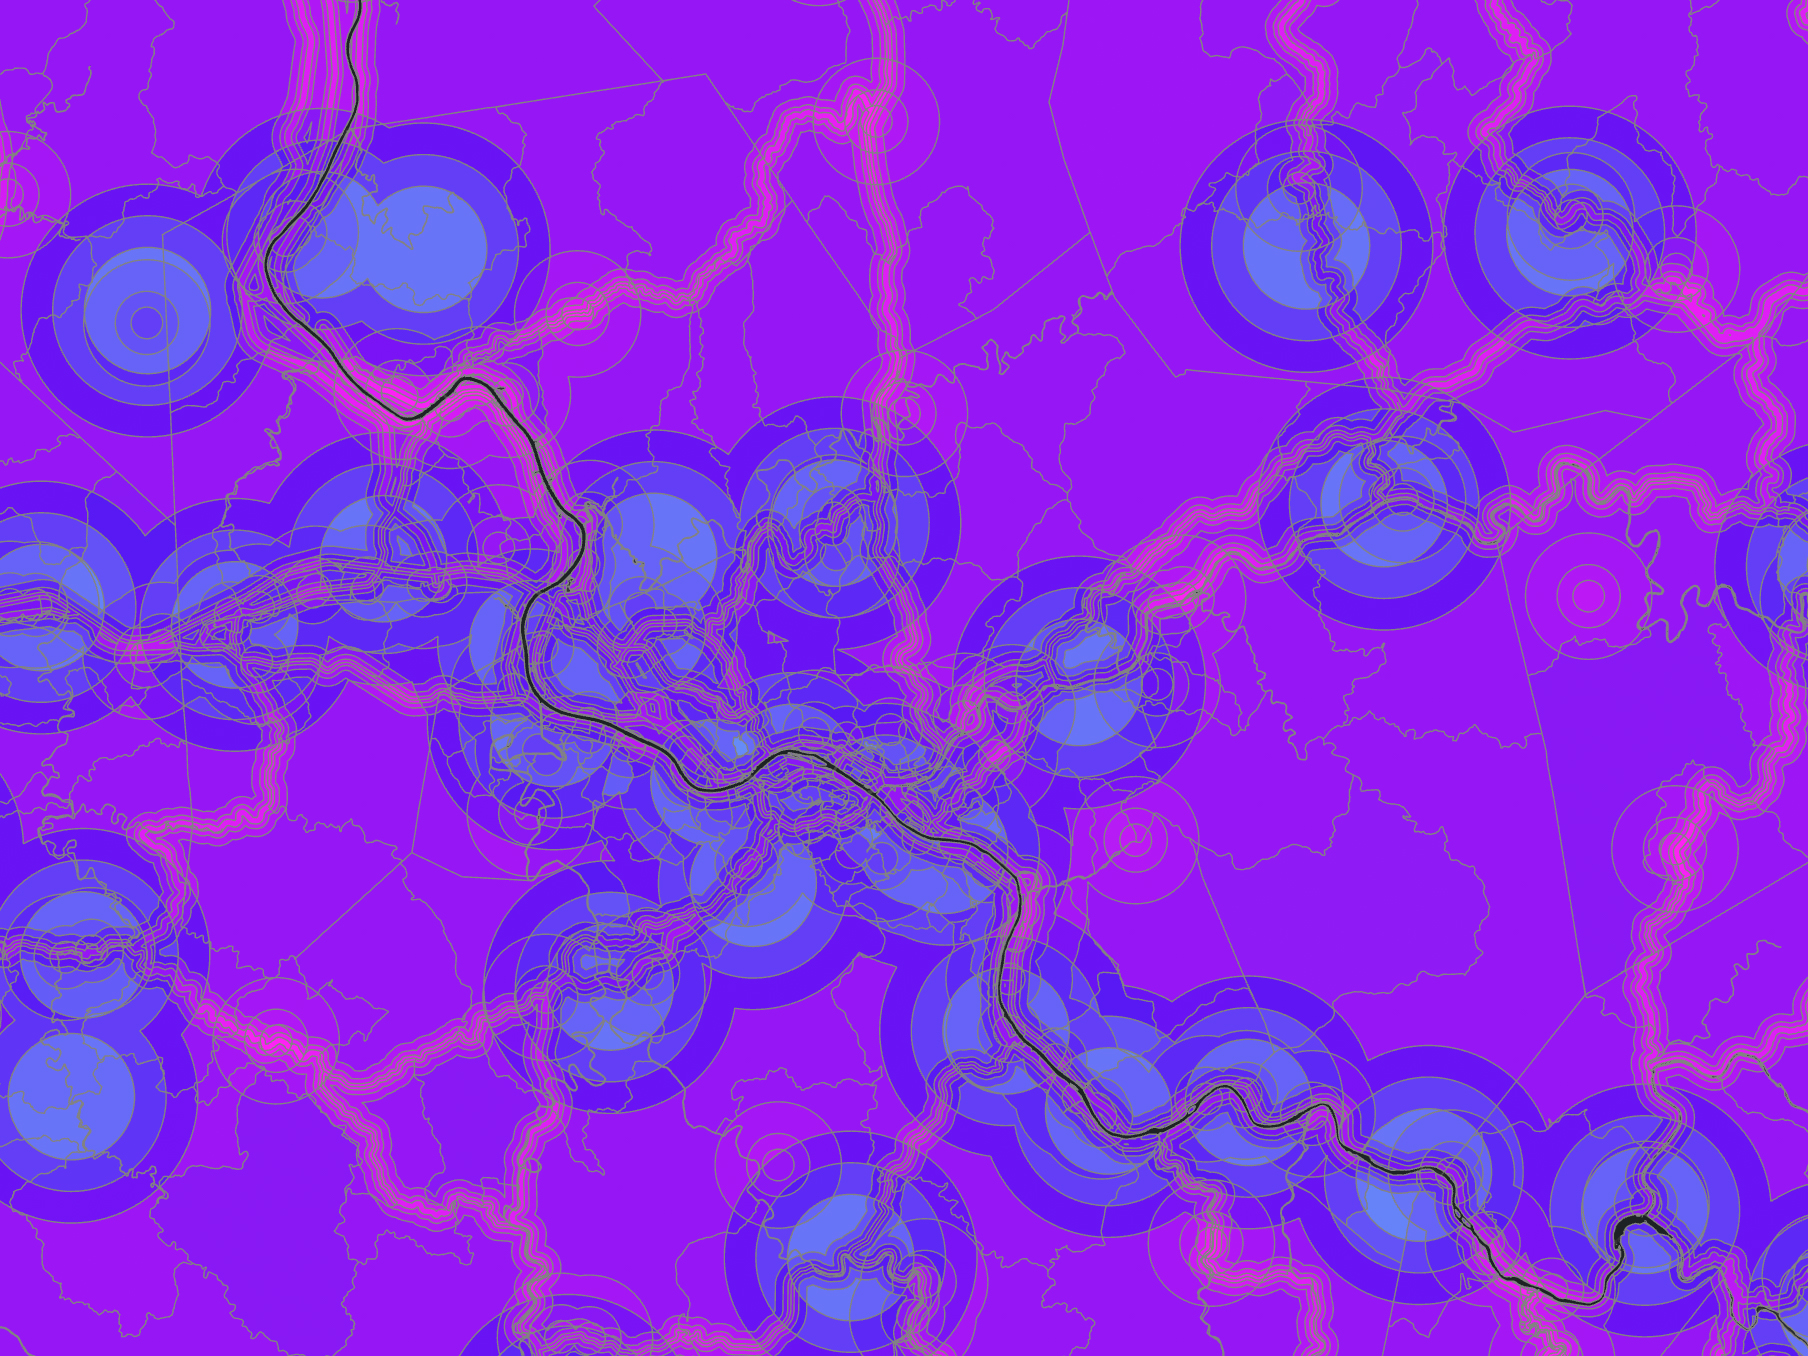
Polygons with a composite score of 3.5 or greater were retained and converted to 218 representative points. Because WLC allows tradeoffs, it identified more candidates than the Boolean model.
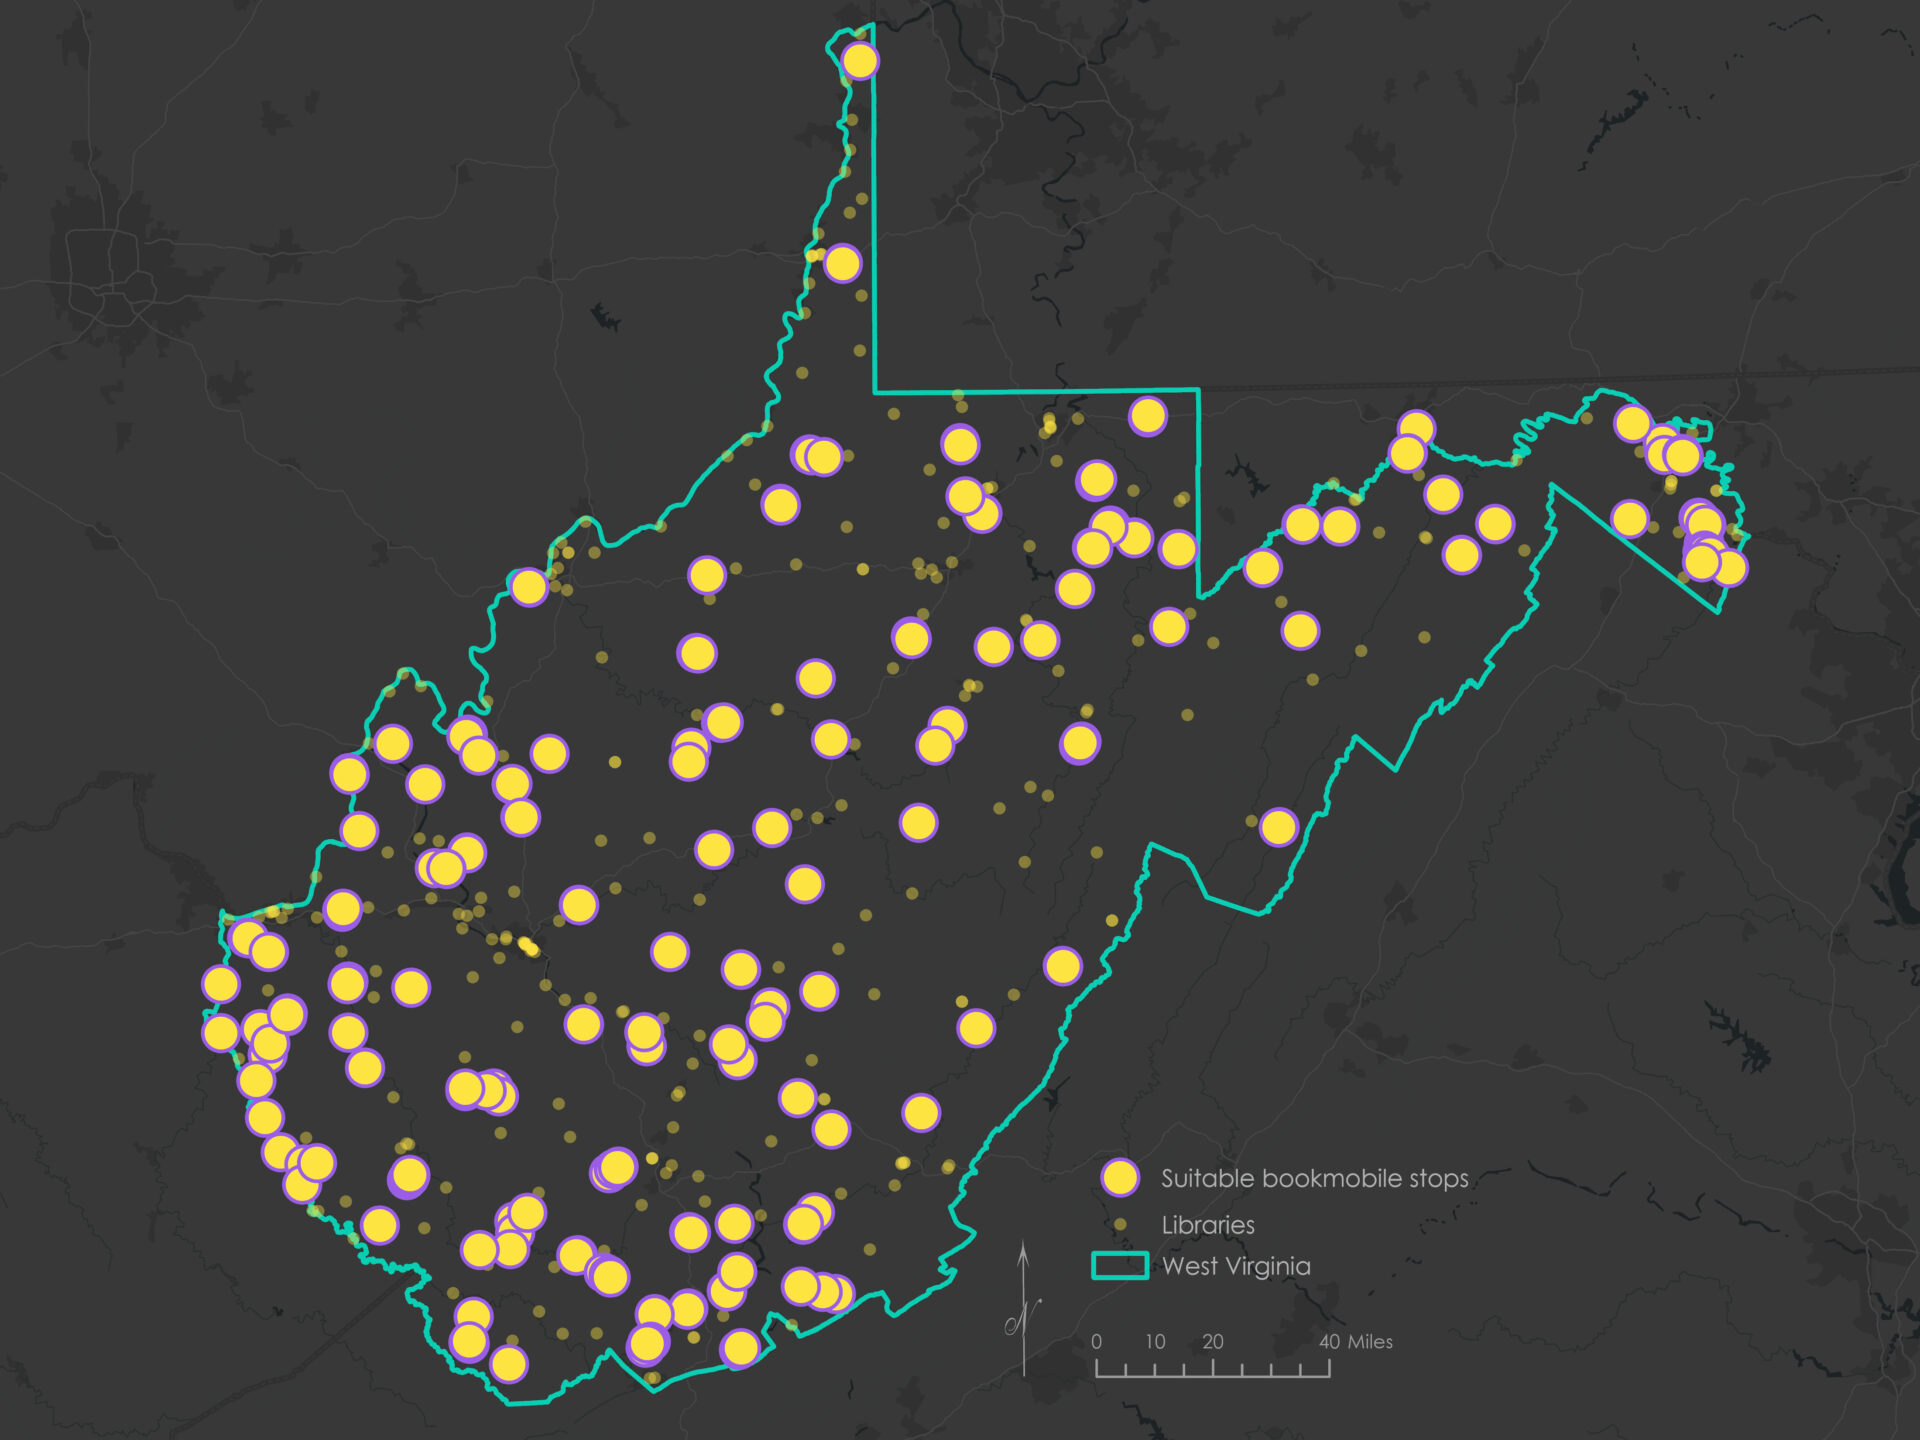
The weighted result is broader and more flexible. It retains areas with strong overall performance even when they do not meet every Boolean threshold, but its interpretation depends more heavily on the selected scores and weights.
Where the methods agree
The Boolean model produced 168 candidate points, while WLC produced 218. Of those, 152 appeared in both results (approximately 90% of the Boolean candidates and 70% of the WLC candidates).
That asymmetry fits the logic of the two methods. Most places that passed every strict requirement also achieved a high weighted score. WLC then added other candidates whose strengths compensated for one or more weaker criteria.
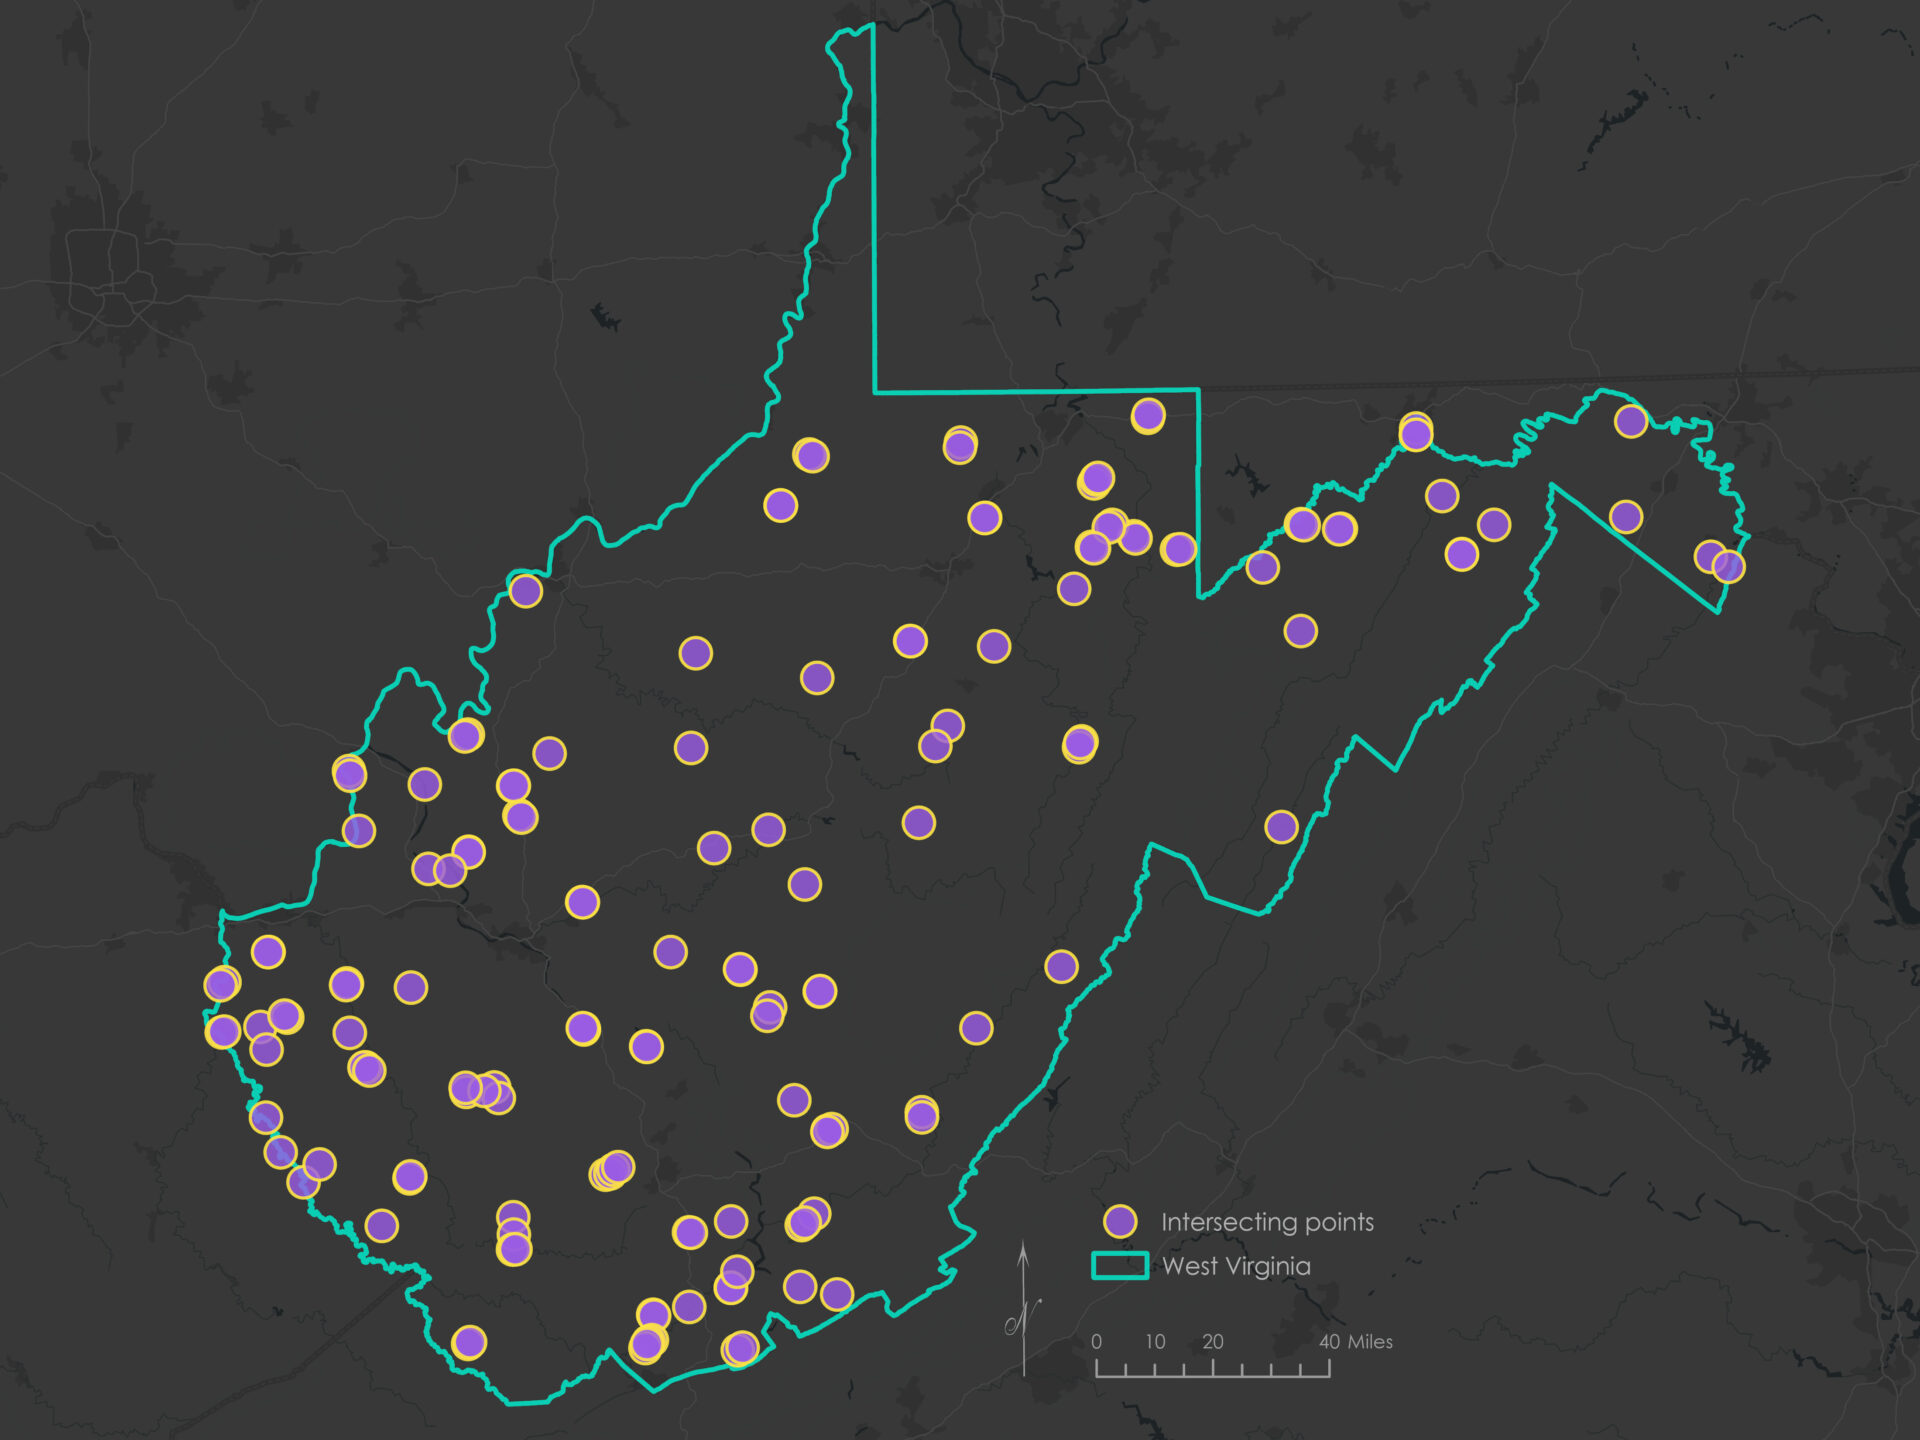
Some candidate points form tight clusters. These do not necessarily represent a need for several separate stops; they can result from neighboring or fragmented overlay polygons being converted to individual points. Further analysis would need to consolidate nearby candidates before selecting service locations.
The results are best interpreted as a statewide screening exercise. Several limitations remain:
- The suitability thresholds and WLC weights are analytical choices; different values would produce different candidates.
- Population criteria rely on 2020 Census data and may not reflect subsequent demographic change.
- Distance buffers measure straight-line proximity rather than driving distance, travel time, or terrain-related accessibility.
- Proximity to a road or school does not establish the presence of a safe stopping area, parking access, property permission, or local demand.
- The representative points identify places for closer review, not verified bookmobile stops.
Together, the two models demonstrate the difference between strict requirements and weighted tradeoffs while identifying a substantial core of shared candidates. The models narrow the statewide search. They do not, by themselves, determine where a bookmobile should park.
Citations
U.S. Census Bureau. (n.d.-a). USA 2020 Census population characteristics [Feature layer]. ArcGIS Living Atlas of the World. https://www.arcgis.com/home/item.html?id=ebeb65deb5c14f4d8849fd68944b7ee6
U.S. Census Bureau. (n.d.-b). USA states (Census) [Feature layer]. ArcGIS Living Atlas of the World. https://www.arcgis.com/home/item.html?id=774019f31f8549c39b5c72f149bbe74e
U.S. Census Bureau. (2024). TIGER/Line shapefiles: Roads [Data set]. https://www.census.gov/cgi-bin/geo/shapefiles/index.php?year=2024&layergroup=Roads
West Virginia GIS Technical Center. (n.d.-a). K–12 public schools, West Virginia [Data set]. https://wvgis.wvu.edu/data/dataset.php?ID=503
West Virginia GIS Technical Center. (n.d.-b). West Virginia public libraries [Data set]. https://wvgis.wvu.edu/data/dataset.php?ID=174
Categories: Mapping, Spatial data management, Spatial analysis