Points on a map can form visible concentrations, but appearance alone cannot tell us whether a pattern is meaningfully clustered. Residential fires, for example, can only occur where residences exist, so incident locations will partly reflect underlying patterns of housing, streets, and population. Point pattern analysis provides a statistical framework for comparing that observed arrangement with a defined spatial baseline.
This project examined 105 residential building fires reported in 2023 within Modesto and the adjacent West Modesto census-designated place in California. Modesto was selected because it ranked first among 150 cities in The Hartford’s 2023 Home Fire Index, a composite measure based on standardized residential fire rates and survey-based fire-safety scores.
Null hypothesis: Residential building fire incidents follow a completely spatially random distribution.
Complete Spatial Randomness (CSR) assumes that incidents occur independently and that every location within the study area has an equal probability of containing an event. Three point-pattern methods approached that assumption from different perspectives:
- Quadrat count asks whether incident counts vary more among equal-sized grid cells than would be expected under a random distribution.
- Average Nearest Neighbor asks whether incidents are closer to or farther from their nearest neighbors than expected.
- Ripley’s K-function asks whether clustering or dispersion changes across a series of distance scales.
Together, these methods can characterize how the incidents are arranged, but they cannot identify why fires occurred or measure the underlying risk faced by individual neighborhoods.

From national incident records to a local fire dataset
The analysis used two publicly available spatial datasets:
| Layer | Source | Dataset or service |
|---|---|---|
| Residential building fires | U.S. Fire Administration / FEMA | 2023 All Incidents GeoPackage |
| Study area boundary | California Open Data Portal | CA Places Boundaries |
The data were downloaded on July 30, 2025. All analytical layers were projected to NAD 1983 (2011) StatePlane California III FIPS 0403 (Meters) (EPSG: 6419), so distances and areas could be calculated in appropriate projected units.
Residential fire records came from the National Fire Incident Reporting System (NFIRS). The U.S. Fire Administration describes its scope as follows:
NFIRS is a reporting standard that fire departments use to uniformly report on the full range of their activities, from fire to emergency medical services.
The 2023 All Incidents GeoPackage is a relational database rather than a ready-made layer of residential fires. To create the local analysis dataset, I joined the main.basicincident and main.fireincident tables to the main.incidentaddress feature class, which contains the incident locations.
I then applied an attribute query based on the NFIRS 5.0 criteria for residential structures, excluded mutual-aid-only responses, and selected incidents that intersected the study-area boundary:
main.basicincident.AID NOT IN ('3', '4')
AND main.basicincident.INC_TYPE IN (111, 120, 122)
AND main.fireincident.STRUC_TYPE IN (1, 2)
AND main.basicincident.PROP_USE IN (
    '400', '419', '429', '439', '449',
    '459', '460', '462', '464'
)
The filtering process produced a final dataset of 105 residential building fire incidents.

Building a repeatable point-pattern workflow
After preparing the incident dataset, I organized the analytical steps in ModelBuilder. ModelBuilder represents a sequence of geoprocessing operations as a visual workflow, making the relationships among inputs, tools, parameters, and outputs easier to inspect and reproduce.
The model reused the same residential-fire dataset and study-area boundary across several analytical branches.
Create Fishnet,Summarize Within, andFrequencygenerated the quadrat counts.- Average Nearest Neighbor compared observed and expected point spacing; and Multi-Distance Spatial Cluster Analysis calculated Ripley’s K across multiple distance bands.
- Point Density and Kernel Density surfaces were also generated during exploratory analysis, although those maps were not needed for the final analysis outputs.
Organizing the tools within one model reduced repeated setup and ensured that regenerated outputs used the same projected inputs and analysis boundary.

Counting incidents across a grid
Quadrat analysis divides an area into equal-sized cells and counts the events within each one. If incidents follow a random process, the variance of the cell counts should be similar to their mean. A variance substantially greater than the mean indicates that events are distributed unevenly, with some cells containing more incidents than others.
For this analysis, a 10 × 10 fishnet divided the rectangular extent surrounding the study area into 100 quadrats.
| Measure | Result |
|---|---|
| Residential fire incidents | 105 |
| Quadrats | 100 |
| Mean incidents per quadrat | 1.05 |
| Observed variance | 1.89 |
| Variance-to-mean ratio | 1.80 |
Half of the quadrats contained no incidents, while the most populated quadrat contained seven. The observed variance of 1.89 exceeded the mean of 1.05, producing a variance-to-mean ratio of 1.80. A ratio greater than 1 is consistent with an uneven or clustered tendency.

This result is best treated as exploratory rather than definitive. The fishnet covers the full rectangular extent surrounding Modesto, including areas outside the irregular study boundary. Empty cells beyond that boundary cannot contain incidents from the filtered dataset, so their inclusion contributes to the observed variation. Quadrat results can also change when the cell size or grid origin changes.
Comparing nearest-neighbor distances
Average Nearest Neighbor (ANN) measures the distance from each incident to its closest neighboring incident. It then compares the observed mean distance with the distance expected if the same number of points were distributed randomly throughout the study area.
The dissolved study-area boundary supplied an area of approximately 100.51 square kilometers for the calculation.
| Measure | Result |
|---|---|
| Observed mean distance | 453.7548 m |
| Expected mean distance | 489.1908 m |
| Nearest Neighbor Ratio | 0.927562 |
| z-score | −1.420011 |
| p-value | 0.155604 |
The observed nearest-neighbor distance was approximately 35 meters shorter than expected. The ratio below 1 therefore indicates a slight tendency toward clustering. However, the z-score of −1.42 and p-value of 0.156 do not provide statistically significant evidence that the pattern differs from CSR at the conventional 0.05 significance level.

Testing clustering across distance scales
ANN reduces the entire point pattern to one average nearest-neighbor distance. Ripley’s K-function, on the other hand, extends the analysis by examining how each point relates to surrounding points across multiple distance bands. This makes it possible to evaluate whether clustering is more pronounced at some spatial scales than others.
The ArcGIS Pro tool applies an L(d) transformation to Ripley’s K, making the observed and expected results easier to compare against distance. The expected line represents CSR. An observed value above that line indicates a tendency toward clustering, while an observed value below it indicates a tendency toward dispersion.
The final analysis evaluated distances from 100 to 1,000 meters. A confidence envelope generated from 999 permutations provided upper and lower 99.9% limits for evaluating statistical significance.
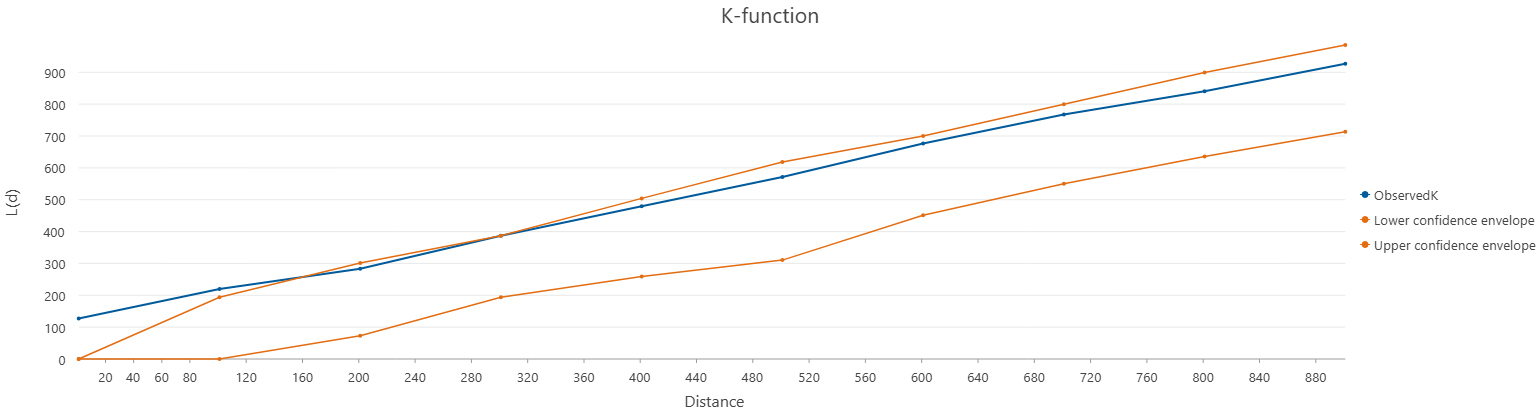
The observed L(d) remained above the expected value at every tested distance, showing a consistent tendency toward clustering. However, the observed line also remained below the upper confidence limit throughout the analysis. The clustering tendency was therefore not statistically significant at the selected 99.9% confidence level.
What the pattern suggests
The three methods describe a point pattern that leans clustered, but they do not support the original conclusion that residential fires were definitively clustered.
The quadrat counts were uneven, and their variance-to-mean ratio was consistent with a clustered tendency. The observed nearest-neighbor distance was also shorter than expected, while Ripley’s K remained above the expected line across all tested distances. Nevertheless, neither ANN nor Ripley’s K provided statistically significant evidence against CSR under the selected criteria. The inferential results therefore did not provide sufficient evidence to reject the null hypothesis.
Several limitations shape that interpretation:
- NFIRS was a voluntary reporting system, so the dataset does not necessarily represent a complete census of every fire incident.
- The analysis included only 105 incidents from one year, limiting the amount of information available for identifying a stable spatial pattern.
- Complete Spatial Randomness (CSR) assumes that every location is equally capable of containing an event, but residential fires can occur only where residences exist.
- The analysis did not adjust for housing density, population, land use, building characteristics, or other measures of exposure.
- The irregular study boundary and incidents near its edges may affect distance-based statistics.
- Quadrat results depend on the size and placement of the grid, and this fishnet included cells extending beyond the study boundary.
- Point-pattern statistics describe the arrangement of reported incidents; they do not identify fire causes or establish neighborhood-level risk.
With these limitations in view, the project demonstrates how complementary spatial statistics can produce a more careful interpretation than visual inspection alone. It also shows the value of a reproducible ModelBuilder workflow and the importance of distinguishing an apparent geographic tendency from statistically significant evidence.
Citations
California Open Data Portal. (n.d.). CA places boundaries [Data set]. https://data.ca.gov/dataset/ca-geographic-boundaries/resource/436fc714-831c-4070-b44b-b06dcde6bf18
Esri. (n.d.-a). Average nearest neighbor (Spatial Statistics) [ArcGIS Pro documentation]. https://pro.arcgis.com/en/pro-app/latest/tool-reference/spatial-statistics/average-nearest-neighbor.htm
Esri. (n.d.-b). Multi-distance spatial cluster analysis (Ripley’s K function) [ArcGIS Pro documentation]. https://pro.arcgis.com/en/pro-app/latest/tool-reference/spatial-statistics/multi-distance-spatial-cluster-analysis.htm
The Hartford. (2023a). The Hartford Junior Fire Marshal Program: Home fire risk [Infographic]. https://assets.thehartford.com/image/upload/junior_fire_marshal_infographic_2023.pdf
The Hartford. (2023b). The Hartford’s 2023 Home Fire Index uncovers significant decrease in behaviors causing home fires [Press release]. https://newsroom.thehartford.com/newsroom-home/news-releases/news-release-details/2023/The-Hartfords-2023-Home-Fire-Index-Uncovers-Significant-Decrease-In-Behaviors-Causing-Home-Fires/default.aspx
U.S. Fire Administration. (n.d.). Access NFIRS data [Data set]. https://www.usfa.fema.gov/data-insights/nfirs/data/
U.S. Fire Administration. (2011). National Fire Incident Reporting System version 5.0: Fire data analysis guidelines and issues [Report]. https://www.usfa.fema.gov/downloads/pdf/nfirs/nfirs_data_analysis_guidelines_issues.pdf
Note: Use of FEMA data does not imply endorsement of this analysis by FEMA or the federal government.
Categories: Mapping, Spatial data management, Spatial analysis