Opening QGIS for the first time felt a little like entering a familiar room after someone had rearranged all the furniture. The underlying spatial concepts hadn’t changed. The challenge was learning where a different program kept the controls.
From there, work moved progressively farther from the familiar desktop GIS interface and into Jupyter notebooks, spatial databases, containerized development environments, and browser-based maps. This collection brings together five repositories created during an Open Source GIS course, each approaching spatial work through a different combination of software, code, data, and documentation.
The QGIS collection was assembled in my own GitHub repository from completed tutorials. The other four projects began with course-provided repository structures that I completed and extended. They represent guided exposure and basic familiarity rather than mastery, but together they helped me understand how spatial analysis can move between desktop software, Python, databases, and the web.
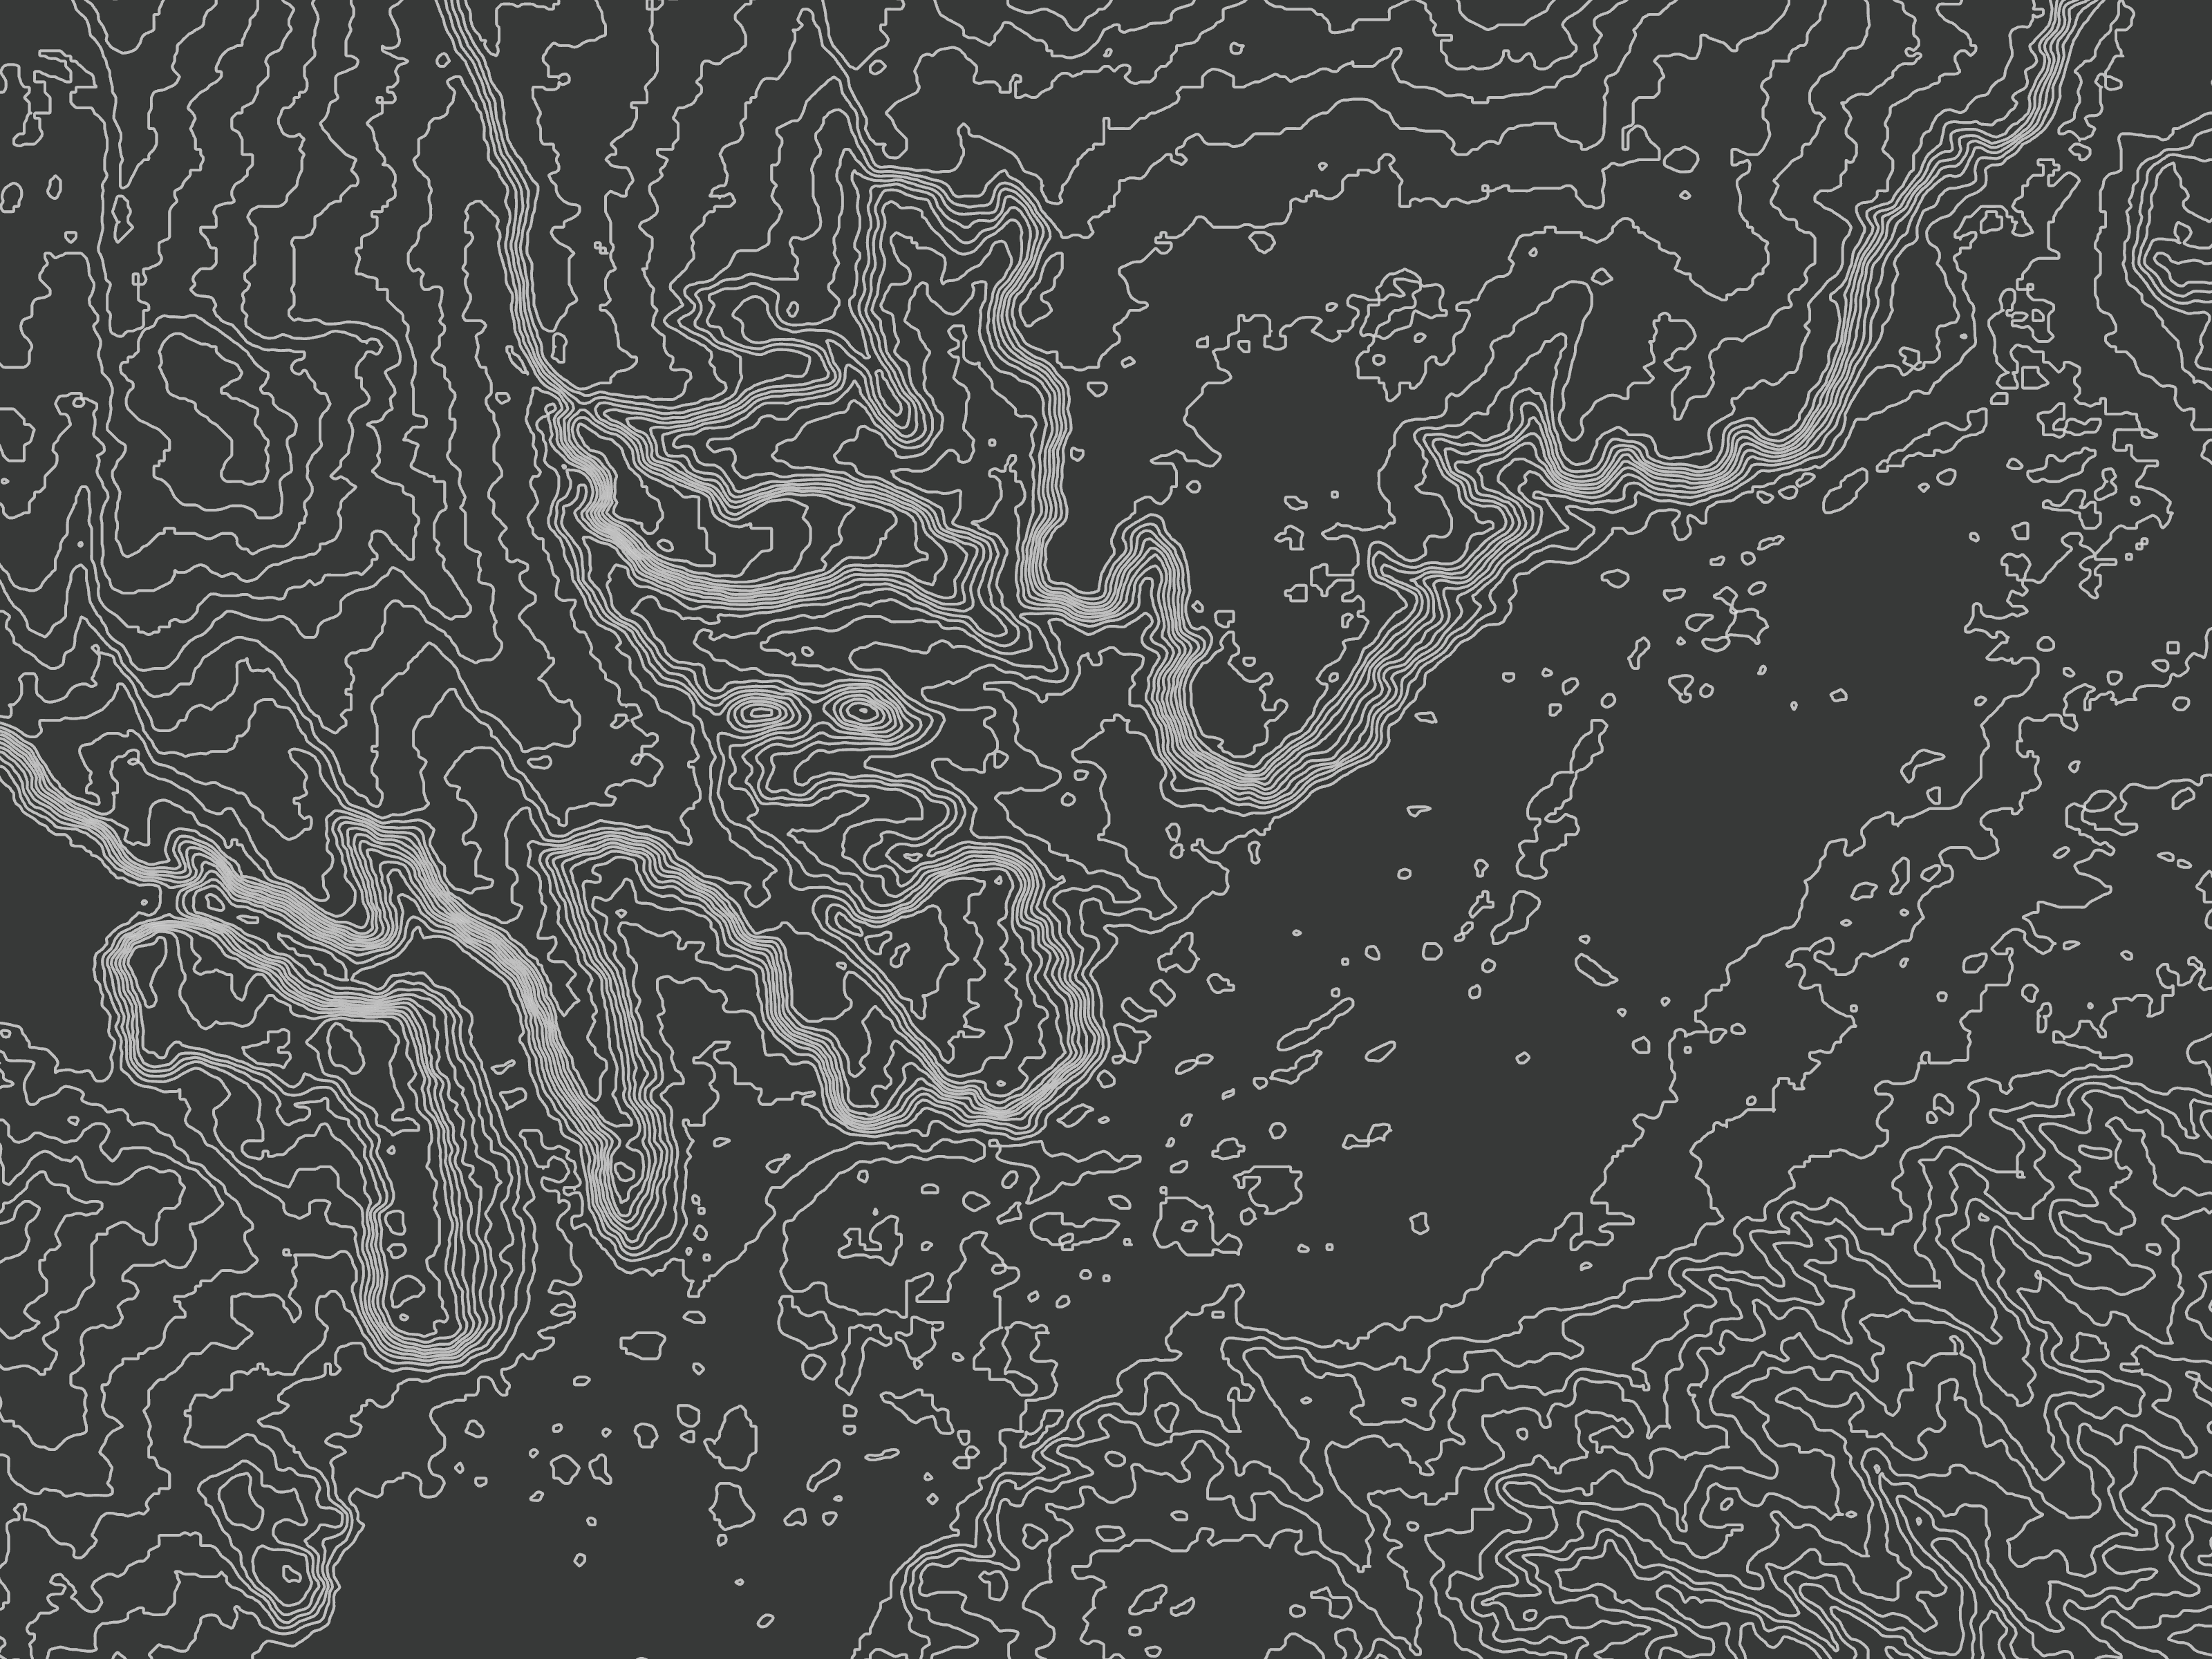
To give the companion GitHub Pages site a visual identity of its own, I created a contour map of Albuquerque and used it as the site’s background. It isn’t an output from one of the five repositories, but it provides a cartographic thread connecting the collection.
Familiar ideas in a different desktop GIS
The QGIS tutorials repository documents ten exercises covering coordinate reference systems, attribute management, raster and vector styling, table and spatial joins, spatial queries, interpolation, and print layout production.
Of the tools explored in this course, QGIS felt the most immediately transferable. Once I became more familiar with its interface, the analytical decisions were largely the same ones I would make in other desktop GIS software: select an appropriate projection, understand the attributes, choose the right spatial operation, inspect the output, and design the result clearly.
One tutorial used depth-sounding measurements from Lake Arlington, Texas, to create an interpolated lake-bottom elevation surface. A triangulated irregular network, or TIN, estimated values between the sampled locations by connecting them into a network of triangles. Island boundaries were incorporated as breaklines, the resulting raster was clipped to the lake boundary, and five-foot contours were generated from the modeled surface.

Taking spatial analysis into Python
The Python for GIS repository introduced open-source tools for tabular, vector, and raster processing. Guided exercises used pandas for environmental observations, GeoPandas for vector operations, and Rasterio for remotely sensed imagery.
The repository was structured to separate exploration from implementation. Methods were first examined in Jupyter notebooks and then completed as reusable functions in Python modules. Those functions were checked against provided pytest test suites, offering an introduction to a more systematic development process than writing and running a single analysis script.
This work included filtering and aggregating tabular observations, transforming coordinate systems, calculating geometric properties, testing spatial relationships, performing spatial joins and overlays, and processing raster data. More than any individual operation, the useful lesson was seeing how an exploratory GIS workflow could be reorganized into code that was reusable, testable, and easier to document.
Asking spatial questions with SQL
The PostGIS spatial database repository was the clearest departure from a tool-by-tool desktop workflow. Instead of running geoprocessing tools against individual files, spatial questions were expressed as SQL queries against data stored in PostgreSQL with the PostGIS extension.
Exercises progressed from basic filtering and aggregation to geometry calculations, proximity analysis, spatial relationships, and joins between datasets. Functions such as ST_Area, ST_Length, ST_Intersects, and ST_DWithin translated familiar GIS ideas into database queries.
The database ran inside a Docker container in GitHub Codespaces. Working within that provided environment offered introductory experience with the supporting infrastructure behind a spatial database: loading data, connecting to the database, organizing SQL files, executing queries, and preserving the work through version control.
Extending a workflow with OpenStreetMap
The OpenStreetMap and PostGIS repository connected several of the course’s components into a more complete workflow. Python handled database setup and data loading, PostGIS performed the spatial analysis, and Jupyter notebooks were used to execute queries, inspect results, and create visualizations.
After working through the provided examples, I extended the workflow to England and developed three queries using OpenStreetMap data:
- Extracting locations tagged as nature reserves
- Comparing railway length relative to county area
- Measuring the distance between hospitals and major roads
The hospital analysis selected named hospitals within one kilometer of roads classified by OpenStreetMap as motorways, trunk roads, or primary roads. For each hospital, the query calculated the distance to its nearest qualifying road.

This extension was useful because it required adapting a repeatable process to a new area and set of questions rather than only reproducing the original examples.
Publishing a browser-based map with Leaflet
The Boston Leaflet WebGIS repository moved the work out of notebooks and databases and into an interactive browser application. Built within a provided project structure, the completed map uses HTML, CSS, JavaScript, Leaflet, and three GeoJSON datasets representing Boston park features, bicycle infrastructure, and neighborhood boundaries.
JavaScript loads and styles the point, line, and polygon layers, generates attribute popups, and organizes the data into selectable layer groups. The application also includes a custom legend, scale bar, constrained map extent, and responsive full-window layout.
Publishing the application through GitHub Pages offered a basic introduction to the full path from prepared spatial data to a public-facing web map. The result is lightweight and self-contained: the browser loads the GeoJSON files directly, and visitors can explore the layers without specialized GIS software.
What I carried forward
I came away from this work less with fluency in every tool than with a better map of the territory. QGIS showed how readily familiar spatial concepts transfer between desktop platforms. Python introduced a more structured relationship between exploration, reusable functions, and testing. PostGIS demonstrated that spatial analysis can happen inside the database itself, while Leaflet carried prepared data into an interactive browser environment.
Git and GitHub provided the thread connecting those pieces. Repositories preserved the code, queries, documentation, environments, and outputs together instead of treating the final map as the only artifact worth keeping. The experience made open-source GIS feel less like a collection of substitutes for proprietary software and more like an interconnected way of organizing spatial work.
Citations
Agafonkin, V. (n.d.). Leaflet. https://leafletjs.com/
Gandhi, U. (n.d.). Interpolating point data (QGIS3). QGIS Tutorials and Tips. https://www.qgistutorials.com/en/docs/3/interpolating_point_data.html
GeoPandas developers. (n.d.). GeoPandas. https://geopandas.org/
OpenStreetMap contributors. (n.d.). OpenStreetMap. https://www.openstreetmap.org/
PostGIS Project Steering Committee. (n.d.). PostGIS. https://postgis.net/
QGIS Project. (n.d.). QGIS: A free and open source geographic information system. https://qgis.org/
Rasterio contributors. (n.d.). Rasterio documentation. https://rasterio.readthedocs.io/
Categories: Spatial data management, Scripting and development