Satellite sensors measure reflected energy from Earth’s surface, but rugged terrain complicates that measurement. Slopes facing the sun receive more direct illumination and may appear brighter than comparable surfaces facing away from it. These differences can obscure the spectral patterns used to distinguish vegetation, soil, snow, water, and other land-cover characteristics.
Topographic correction attempts to reduce this terrain-driven variation so that image brightness more closely represents surface properties rather than slope orientation. It does not remove shadows or recover information that the sensor could not observe, but it can make reflectance values more comparable across illuminated and shaded terrain.
This project applies topographic correction to Landsat 8 imagery covering part of Himachal Pradesh in the western Himalaya. The area’s steep ridges and deeply incised valleys make it a useful setting for examining how terrain affects satellite imagery. The workflow was completed in RStudio using the terra and pracma packages and a provided topCor() function.
The analysis involved:
- Aligning elevation data with the Landsat imagery
- Deriving slope and aspect from the elevation model
- Modeling illumination from terrain orientation and the sun’s position
- Applying a regression-based correction to each spectral band
- Comparing uncorrected and corrected image composites
Data sources
| Data | Source | Dataset and details |
|---|---|---|
| Landsat 8 surface reflectance | USGS EarthExplorer | Landsat Collection 2 Level-2 product LC08_L2SP_147038_20241126_20241202_02_T1; acquired November 26, 2024; WRS path 147, row 038; bands 2–7; 30-meter resolution; WGS 84 / UTM zone 43N |
| Elevation | USGS EarthExplorer | Shuttle Radar Topography Mission tile SRTM1N31E077V3; approximately 30-meter, or 1-arc-second, resolution; covering 31–32° N and 77–78° E |
The Landsat scene is centered at approximately 31.742° N, 77.089° E. Because the SRTM tile covers a smaller area than the complete Landsat scene, the analysis was limited to their shared spatial extent.
USGS Collection 2 Level-2 surface-reflectance products include atmospheric correction, but atmospheric and topographic correction address different sources of variation. Surface reflectance processing reduces atmospheric effects, while topographic correction addresses differences caused by terrain illumination.
Viewing the terrain across spectral bands
A natural-color composite provides geographic context by assigning the Landsat red, green, and blue bands to their corresponding display colors. The resulting image resembles what the landscape might look like to the human eye, including snow-covered peaks, forested slopes, river valleys, and developed areas.
A color-infrared composite offers a different view of the same terrain. It assigns near-infrared, red, and green reflectance to the display’s red, green, and blue channels. Healthy vegetation reflects strongly in near-infrared wavelengths and therefore appears red, while snow, water, bare ground, and developed surfaces respond differently.
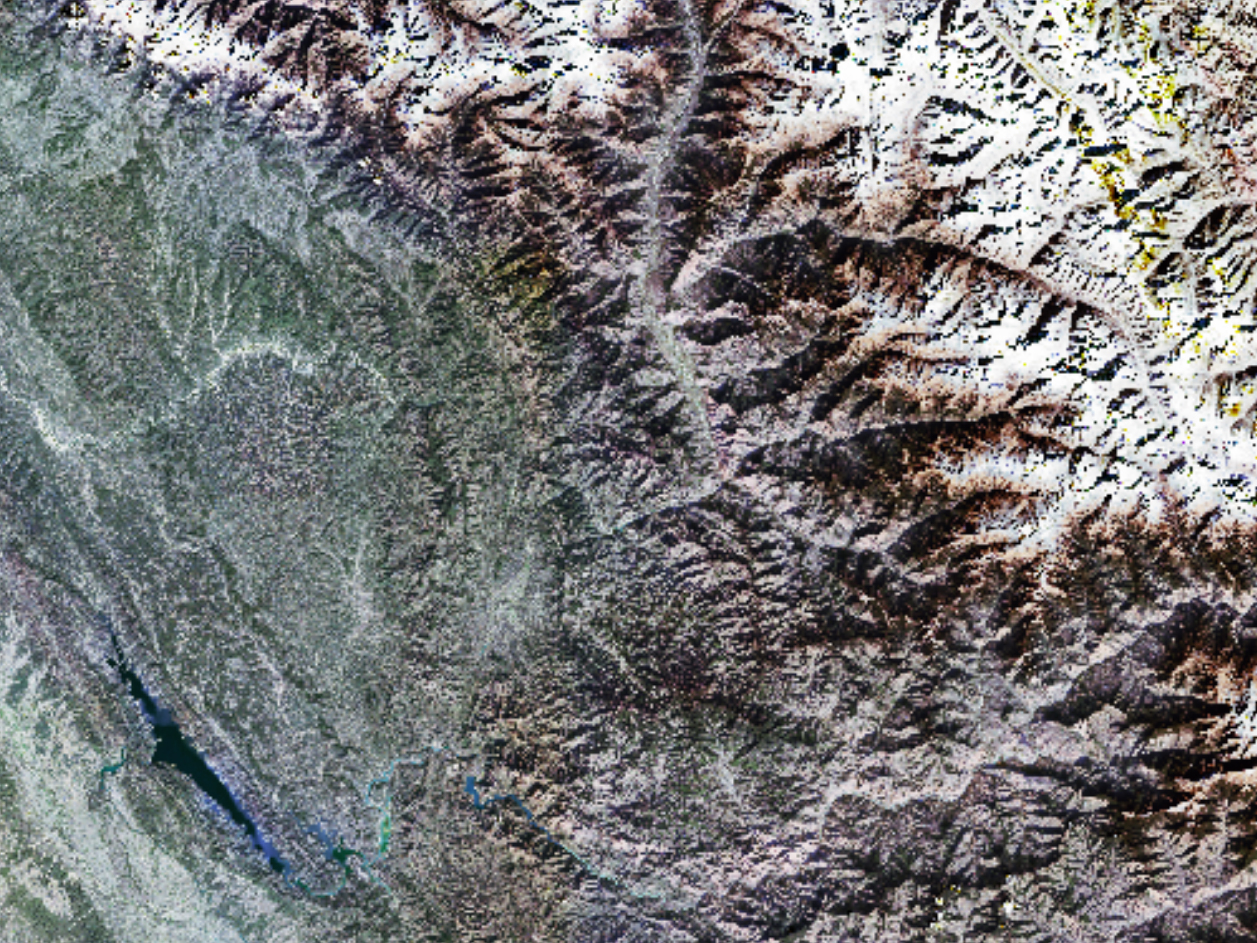
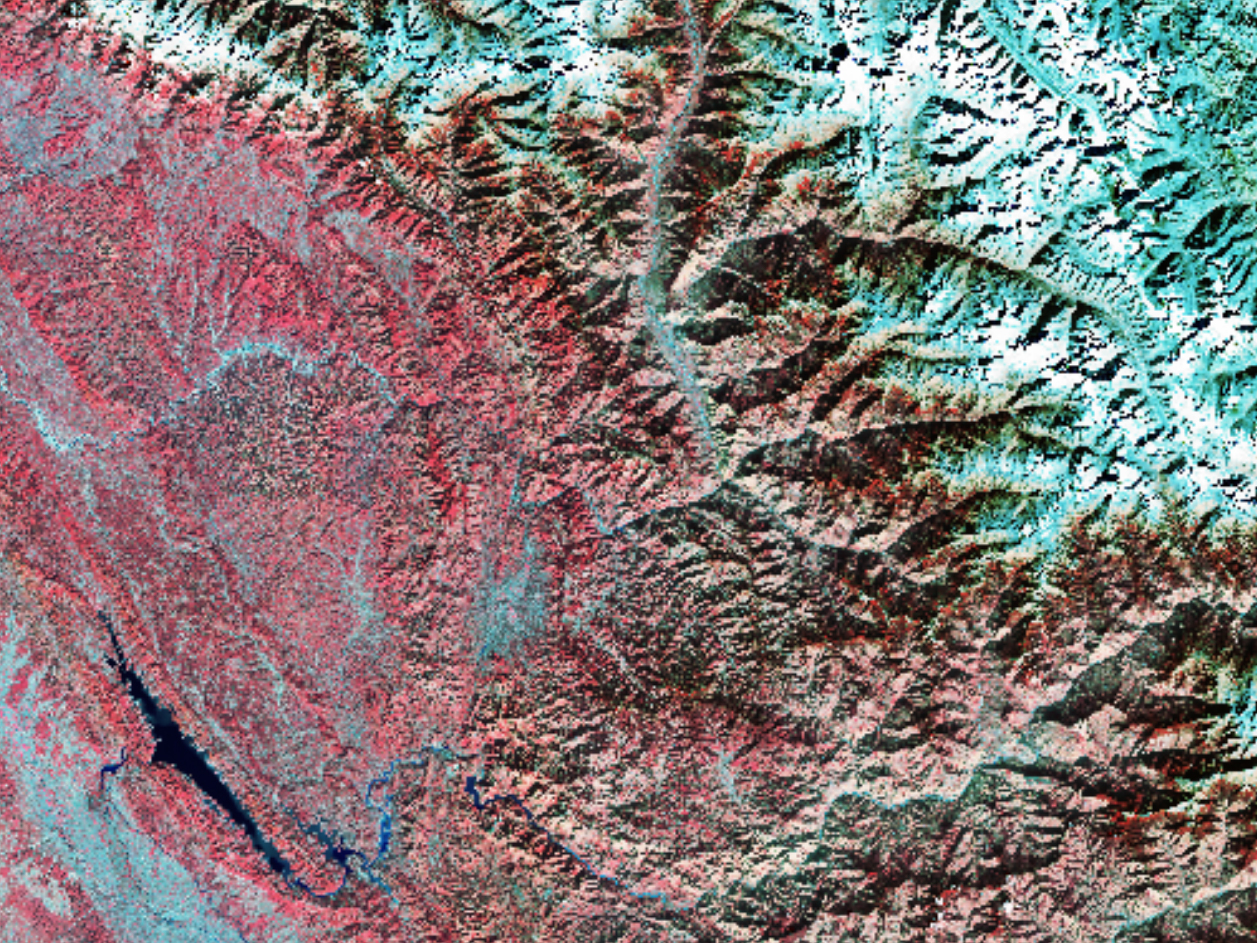
Both composites reveal strong changes in brightness across adjacent slopes. Some of that variation represents actual differences in land cover, but some results from the direction and intensity of incoming sunlight.
Aligning elevation with satellite imagery
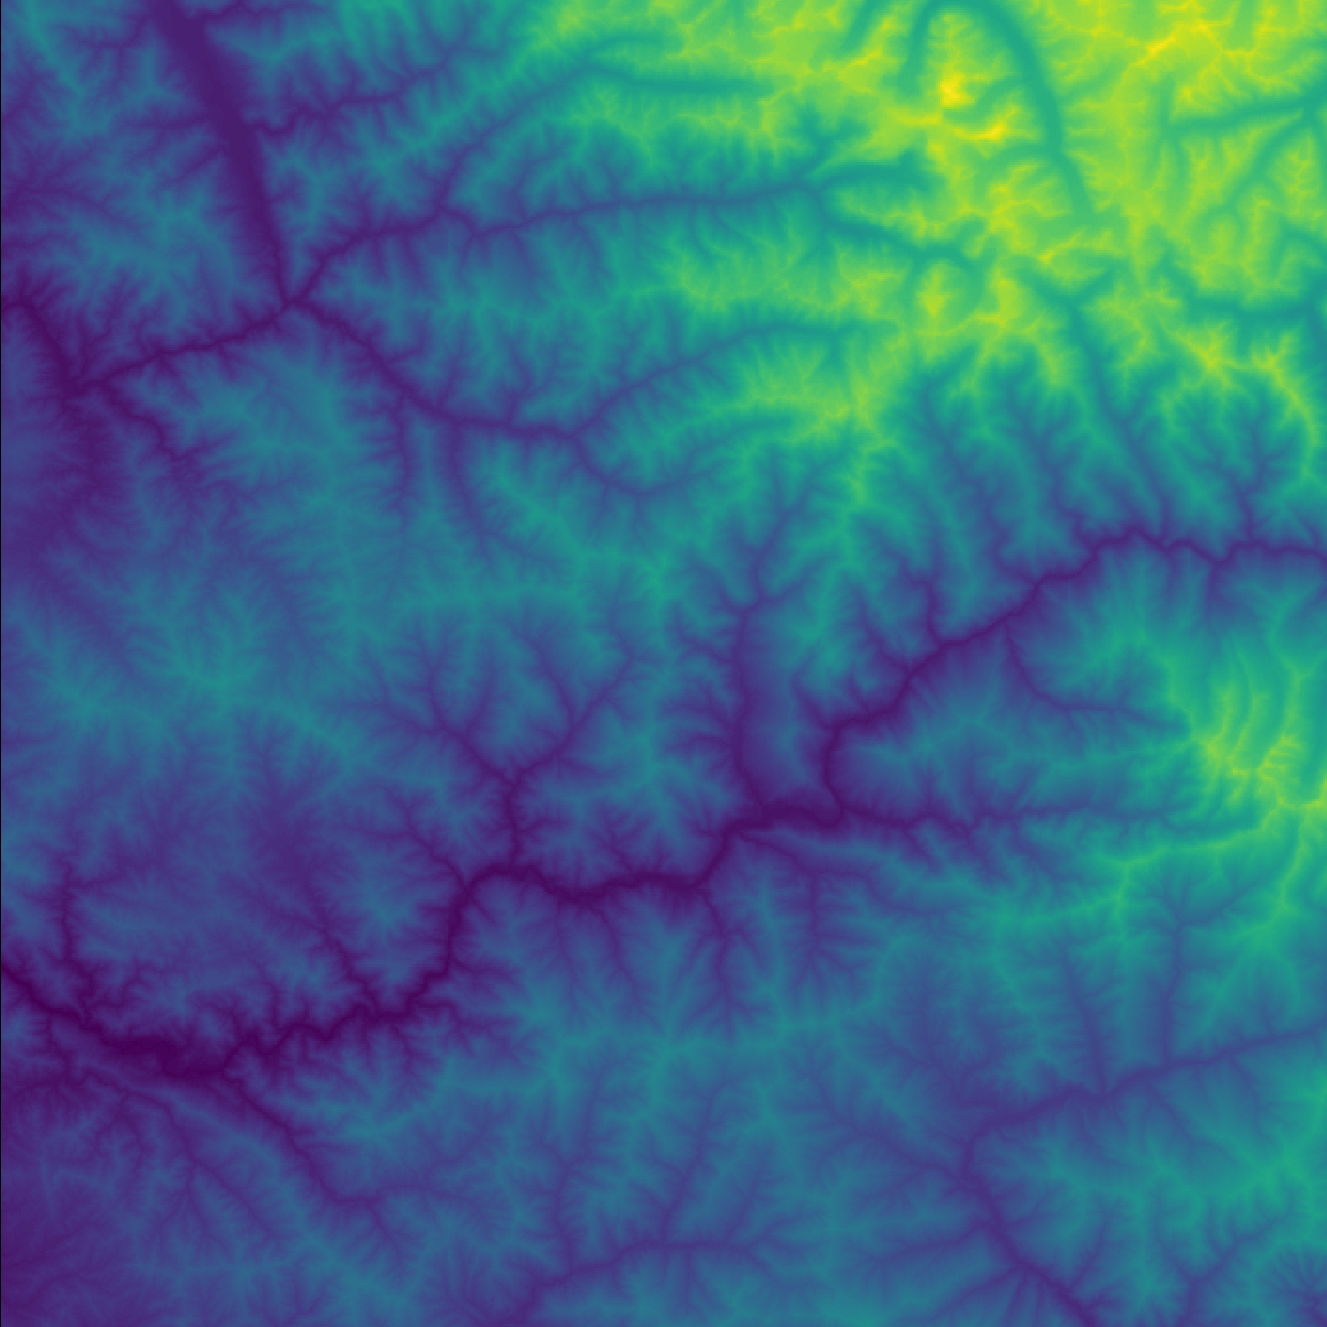
Topographic correction requires elevation data that corresponds precisely with the satellite image grid. The SRTM elevation tile and Landsat imagery initially differed in their coordinate systems, resolutions, extents, and pixel alignment.
In R, the elevation model was projected and resampled to match the Landsat grid. Both datasets were then cropped and masked to their common valid extent. This step ensured that each Landsat pixel corresponded with the appropriate elevation value before terrain derivatives were calculated.
Lighter tones represent higher elevations, while darker areas are lower in elevation.
The aligned elevation model was used to derive two important terrain properties:
- Slope measures how steeply the land surface rises or falls.
- Aspect identifies the compass direction a slope faces.
Together, slope and aspect describe how each part of the terrain is oriented relative to the sun.
Modeling illumination across the slopes
The Landsat metadata reported a solar elevation of approximately 34.29° and a solar azimuth of approximately 158.84° at the time of acquisition. These values describe the sun’s height above the horizon and its direction relative to north.
The illumination model combined this solar geometry with the slope and aspect rasters. Pixels oriented toward the sun received higher modeled illumination values, while slopes facing away from it received lower values.
slope <- terrain(srtm_masked, v = "slope")
aspect <- terrain(srtm_masked, v = "aspect")

IlluMod <- topCor(
  L8_masked,
  slope,
  aspect,
  azimuth = 158.83663766,
  elevation = 34.28733739,
  method = "illu"
)
This short example shows the essential inputs used to create the illumination model. The complete workflow also included importing the raster data, aligning the elevation model with the Landsat grid, masking the shared extent, and preparing the corrected outputs.
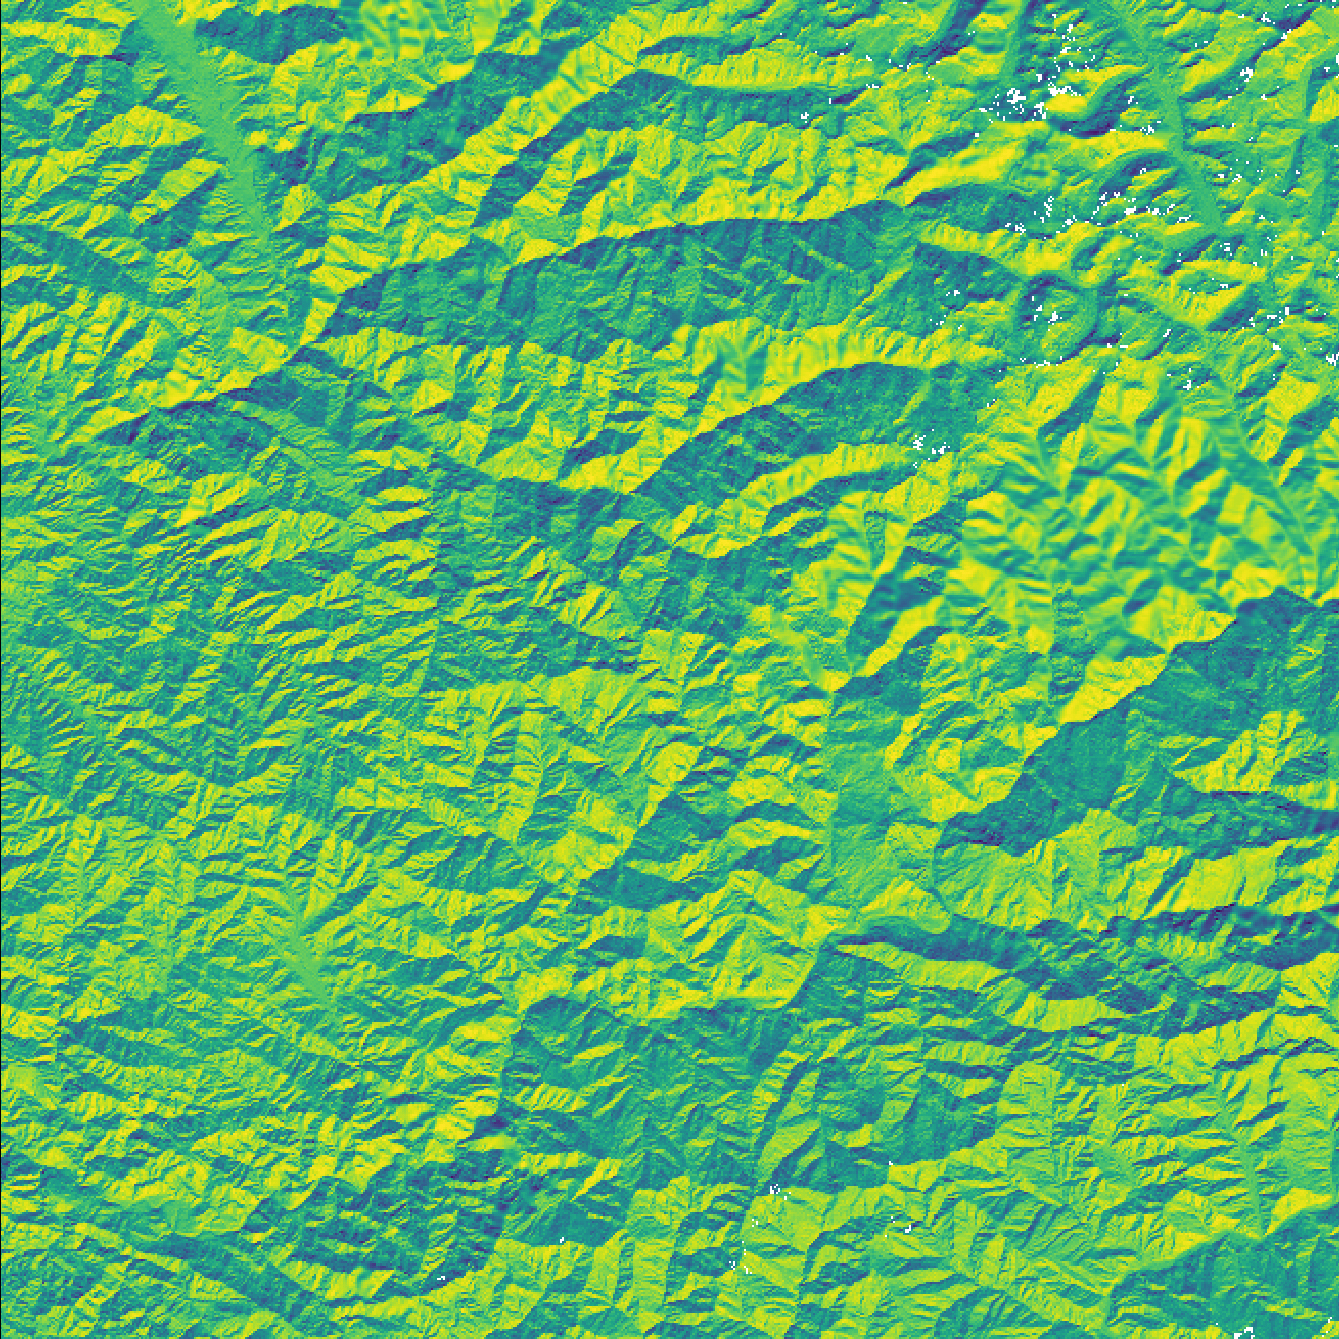
The illumination model is not a map of land cover or surface reflectance. Instead, it estimates how strongly terrain orientation alone may influence the brightness recorded by the sensor.
Reducing terrain-driven brightness
The correction was applied separately to each Landsat band using a regression-based method. For each band, the topCor() function modeled the relationship between reflectance and terrain illumination. It then removed the estimated illumination-related component from the band values.
L8_maskedCor <- topCor(
  L8_masked,
  slope,
  aspect,
  azimuth = 158.83663766,
  elevation = 34.28733739
)
Processing each band independently is important because vegetation, soil, snow, rock, and water respond differently across the electromagnetic spectrum. The effect of illumination is therefore not identical in every band.
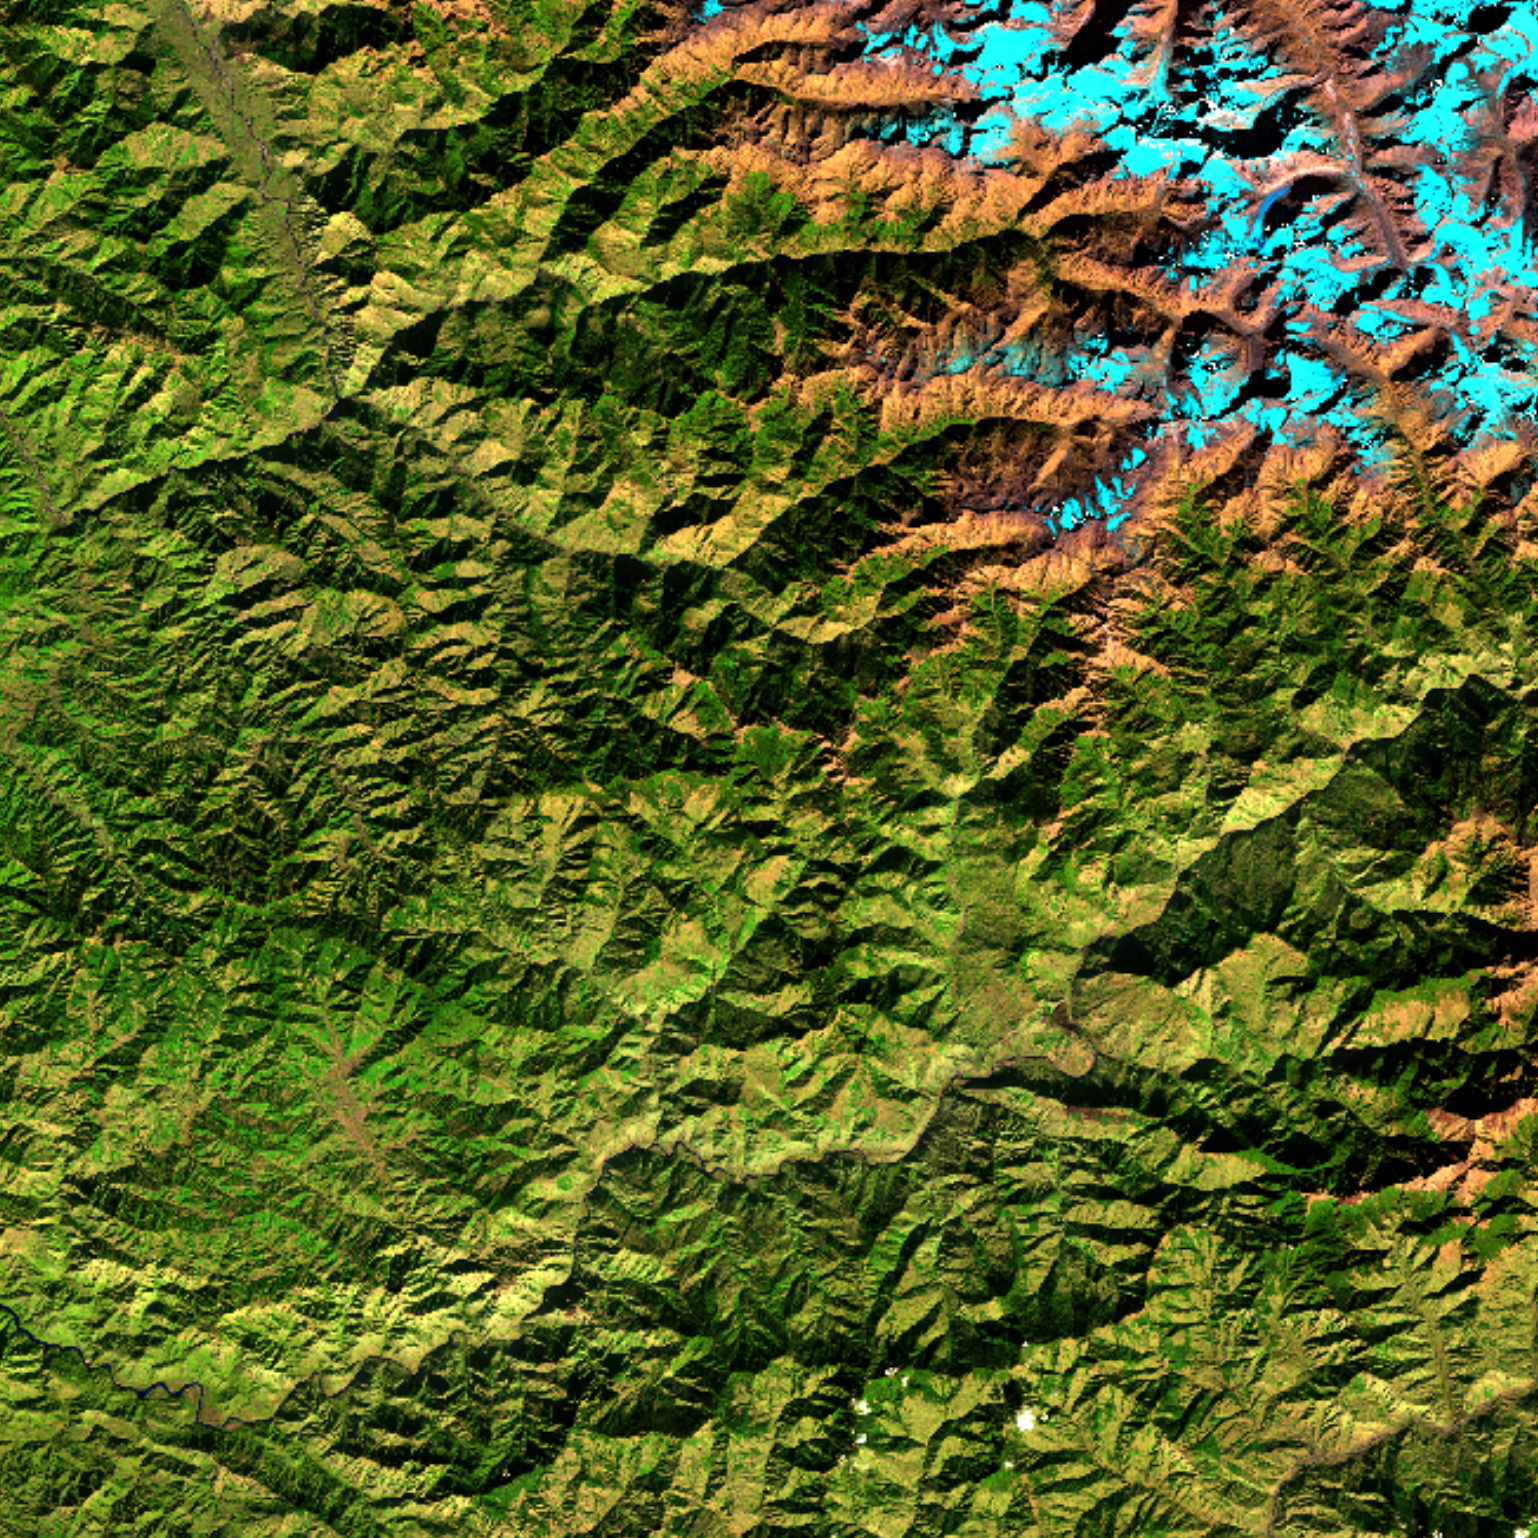
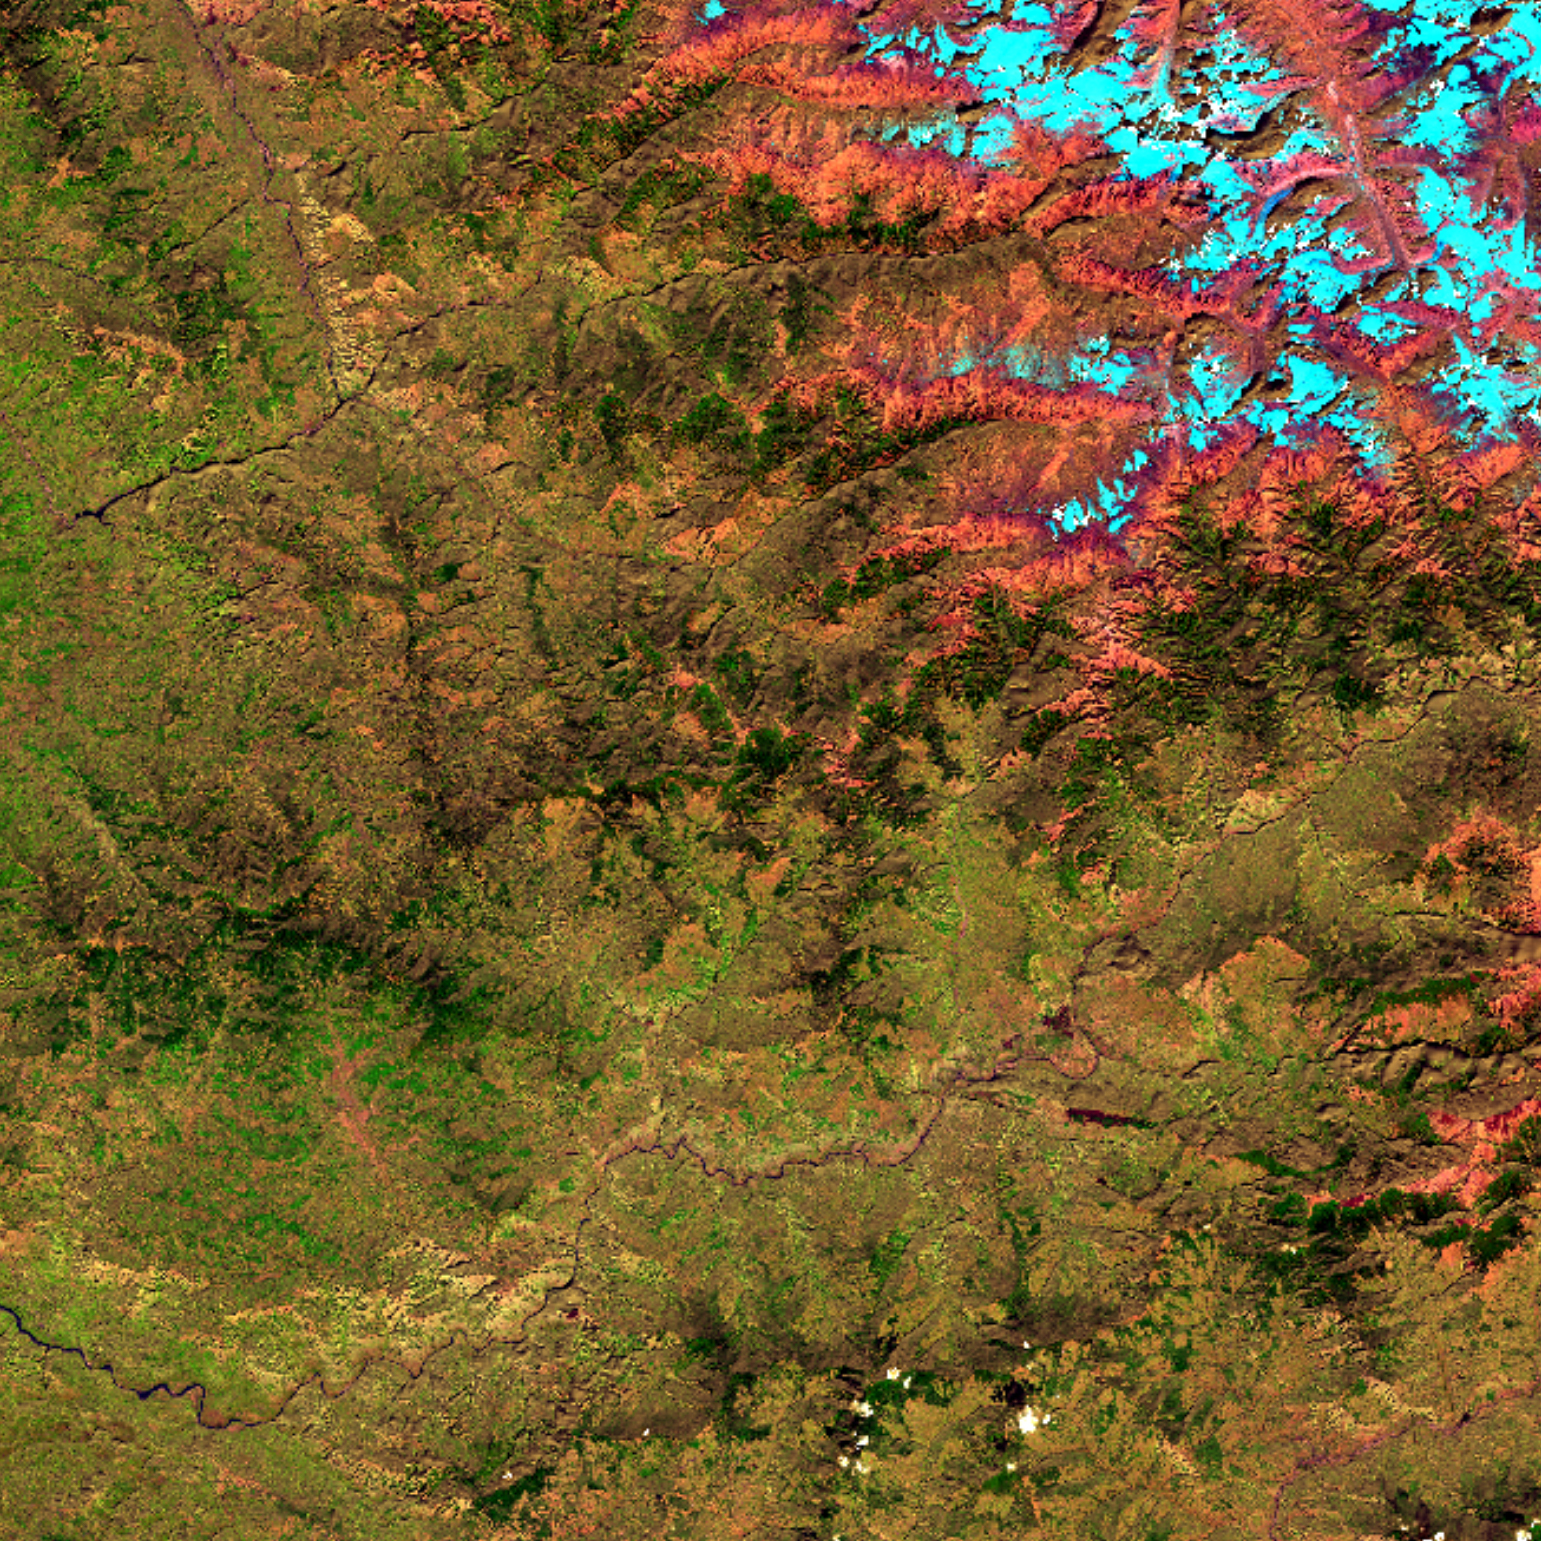
To compare the results, I created uncorrected and corrected composites using Landsat bands 6, 5, and 4. This combination assigns shortwave infrared, near-infrared, and red reflectance to the display’s red, green, and blue channels. It is useful for distinguishing vegetation, moisture, snow, bare terrain, and other surface characteristics.
What the correction changes
The comparison illustrates how topographic correction can reduce terrain-related variation without eliminating meaningful geographic patterns. Ridges, valleys, vegetation, snow, bare ground, and developed areas remain visible, but some of the contrast associated with slope orientation is less pronounced in the corrected composite.
The results should still be interpreted with several limitations in mind:
- Topographic correction cannot restore spectral information lost in deep cast shadows.
- Results depend on the accuracy, resolution, and alignment of the elevation model.
- Errors in solar metadata, slope, or aspect can affect the modeled illumination.
- Correcting each band separately can change the apparent color balance of a multiband composite.
- The uncorrected and corrected images were displayed using separate linear stretches, so the visual comparison is illustrative rather than a controlled measure of accuracy.
- No field observations, classification results, or independent spectral measurements were available to quantify improvement.
Within those limits, the project demonstrates how terrain modeling can address an important source of variation in remotely sensed imagery. Integrating elevation, solar geometry, and multispectral reflectance in R produced a more terrain-aware representation of the landscape and a clearer foundation for subsequent image interpretation or analysis.
Citations
Borchers, H. W. (n.d.). pracma: Practical numerical math functions [R package]. CRAN. https://cran.r-project.org/package=pracma
Hijmans, R. J. (n.d.). terra: Spatial data analysis [R package]. CRAN. https://cran.r-project.org/package=terra
U.S. Geological Survey. (n.d.-a). EarthExplorer [Data portal]. https://earthexplorer.usgs.gov/
U.S. Geological Survey. (n.d.-b). Landsat Collection 2 Level-2 science products [Technical documentation]. https://www.usgs.gov/landsat-missions/landsat-collection-2-level-2-science-products
U.S. Geological Survey. (n.d.-c). Landsat Collection 2 surface reflectance [Technical documentation]. https://www.usgs.gov/landsat-missions/landsat-collection-2-surface-reflectance
U.S. Geological Survey. (n.d.-d). Shuttle Radar Topography Mission 1 arc-second global [Data set]. https://www.usgs.gov/centers/eros/science/usgs-eros-archive-digital-elevation-shuttle-radar-topography-mission-srtm-1
Categories: Mapping, Scripting and development, Image and remote sensing