Japan experiences thousands of earthquakes per year, and many additional tremors that go unfelt. This activity reflects the country’s position at the meeting point of several tectonic plates, with many earthquakes occurring offshore along the surrounding plate boundaries.
A map of recent earthquakes (such as the USGS Latest Earthquakes) shows where recorded events have occurred, but it cannot describe the entire seismic landscape. Fault traces and plate boundaries provide geological context, long-term forecasts identify where strong ground motion is more likely, and population estimates show where people live in relation to those patterns.
I brought these perspectives together through two interactive web applications. The first allows users to filter recent earthquakes by time and magnitude while viewing them alongside faults and plate boundaries. The second uses a swipe tool to compare population distribution with the probability of strong shaking over a 30-year period.
Together, the applications support questions such as:
- Where have earthquakes occurred recently?
- How do those events appear in relation to faults and plate boundaries?
- Where do higher population densities overlap with higher probabilities of strong shaking?
The project is exploratory rather than predictive. It does not attempt to forecast individual earthquakes or provide a complete assessment of seismic risk. Instead, it gives non-specialists a way to explore several related datasets.
Both applications focus on Japan and nearby offshore areas. Their map extents are constrained to keep attention on the region rather than allowing users to pan indefinitely across the globe.
Data and application design
The applications combine live and reference data from the U.S. Geological Survey, ArcGIS Living Atlas, and Japanese organizations responsible for seismic research and monitoring.
| Layer | Dataset or service | Role in the applications |
|---|---|---|
| Recent earthquakes | Recent Earthquakes | Provides a frequently updated earthquake feed that can be filtered by location, date, and magnitude. |
| Active faults | Global Active Earthquake Faults | Supplies generalized fault traces for geographic context. |
| Seismic motion forecast | Probabilistic seismic motion forecast map, maximum case | Maps the probability of strong shaking over a 30-year period. |
| Population | Global estimated population in 2020 | Estimates total population per approximately 1 km cell. |
| Prefecture boundaries | Japan prefecture boundaries 2025 | Provides administrative context within Japan. |
| Tectonic Plates | Tectonic Plates and Boundaries | Shows major plate polygons and boundaries around Japan. |
I developed both interactive maps as standalone applications using the ArcGIS Maps SDK for JavaScript, Calcite components, and ArcGIS web components. They are embedded in this post for direct use and can also be opened in separate windows for a larger viewing area. Shared web maps provide the source layers and initial symbology, while custom JavaScript manages the filtering, live statistics, layer visibility, map constraints, translated legend text, and swipe behavior.
Explore recent earthquake activity
The interactive application embedded below filters a live earthquake feed to Japan and its surrounding waters. Users can narrow the visible events by date and minimum magnitude, while active faults, plate boundaries, and prefecture boundaries provide geographic context. A statistical panel updates with the filtered results.
Navigating the earthquake explorer
- Move through time → Adjust the time slider to change the earthquake window. The event symbols and statistical summary update with the selected dates.
- Set a magnitude threshold → Use the magnitude control to remove smaller events and focus on stronger earthquakes.
- Inspect an event → Select an earthquake to view its location, depth, magnitude, time, and tsunami-warning status.
- Explore the region → Pan and zoom to examine how recent events appear in relation to Japan’s coastlines, faults, and plate boundaries.
The application documents recent activity; it does not indicate where the next earthquake will occur.
Compare population and shaking probability
The second application uses a swipe tool to compare estimated population with a probabilistic seismic motion forecast published through Japan’s J-SHIS system. The population layer appears on the left side of the swipe handle, while the forecast appears on the right.
The forecast represents the probability that a location will experience JMA seismic intensity 6 Lower or stronger between 2023 and 2052. Comparing the two surfaces makes it possible to examine where densely populated areas coincide with higher probabilities of strong shaking.
The seismic motion forecast layer (published by Japan’s J-SHIS) may take a while to load, especially on slower connections.
Navigating the comparison
- Explore an area → Pan and zoom to focus on a particular region, such as Tokyo, Osaka, or coastal Tohoku.
- Move the swipe handle → Drag the vertical divider to reveal more of either the population layer or the seismic forecast.
- Interpret the overlap carefully → The map represents population exposure to potential shaking, not complete earthquake risk. It does not model building vulnerability, preparedness, infrastructure resilience, tsunamis, fire, or other secondary hazards.
Understanding the JMA seismic intensity scale
Magnitude and intensity are easy to collapse into one idea, but they describe different things. Magnitude measures the total energy released by an earthquake. Seismic intensity describes how strongly the ground shakes at a particular location and can vary with distance, geology, topography, and other site conditions.
The Japan Meteorological Agency uses a 10-level scale:
- 0 through 4
- 5 Lower
- 5 Upper
- 6 Lower
- 6 Upper
- 7
The forecast used in the comparison app focuses on intensity 6 Lower or stronger. At 6 Lower, remaining standing becomes difficult and unsecured furniture may move or topple.
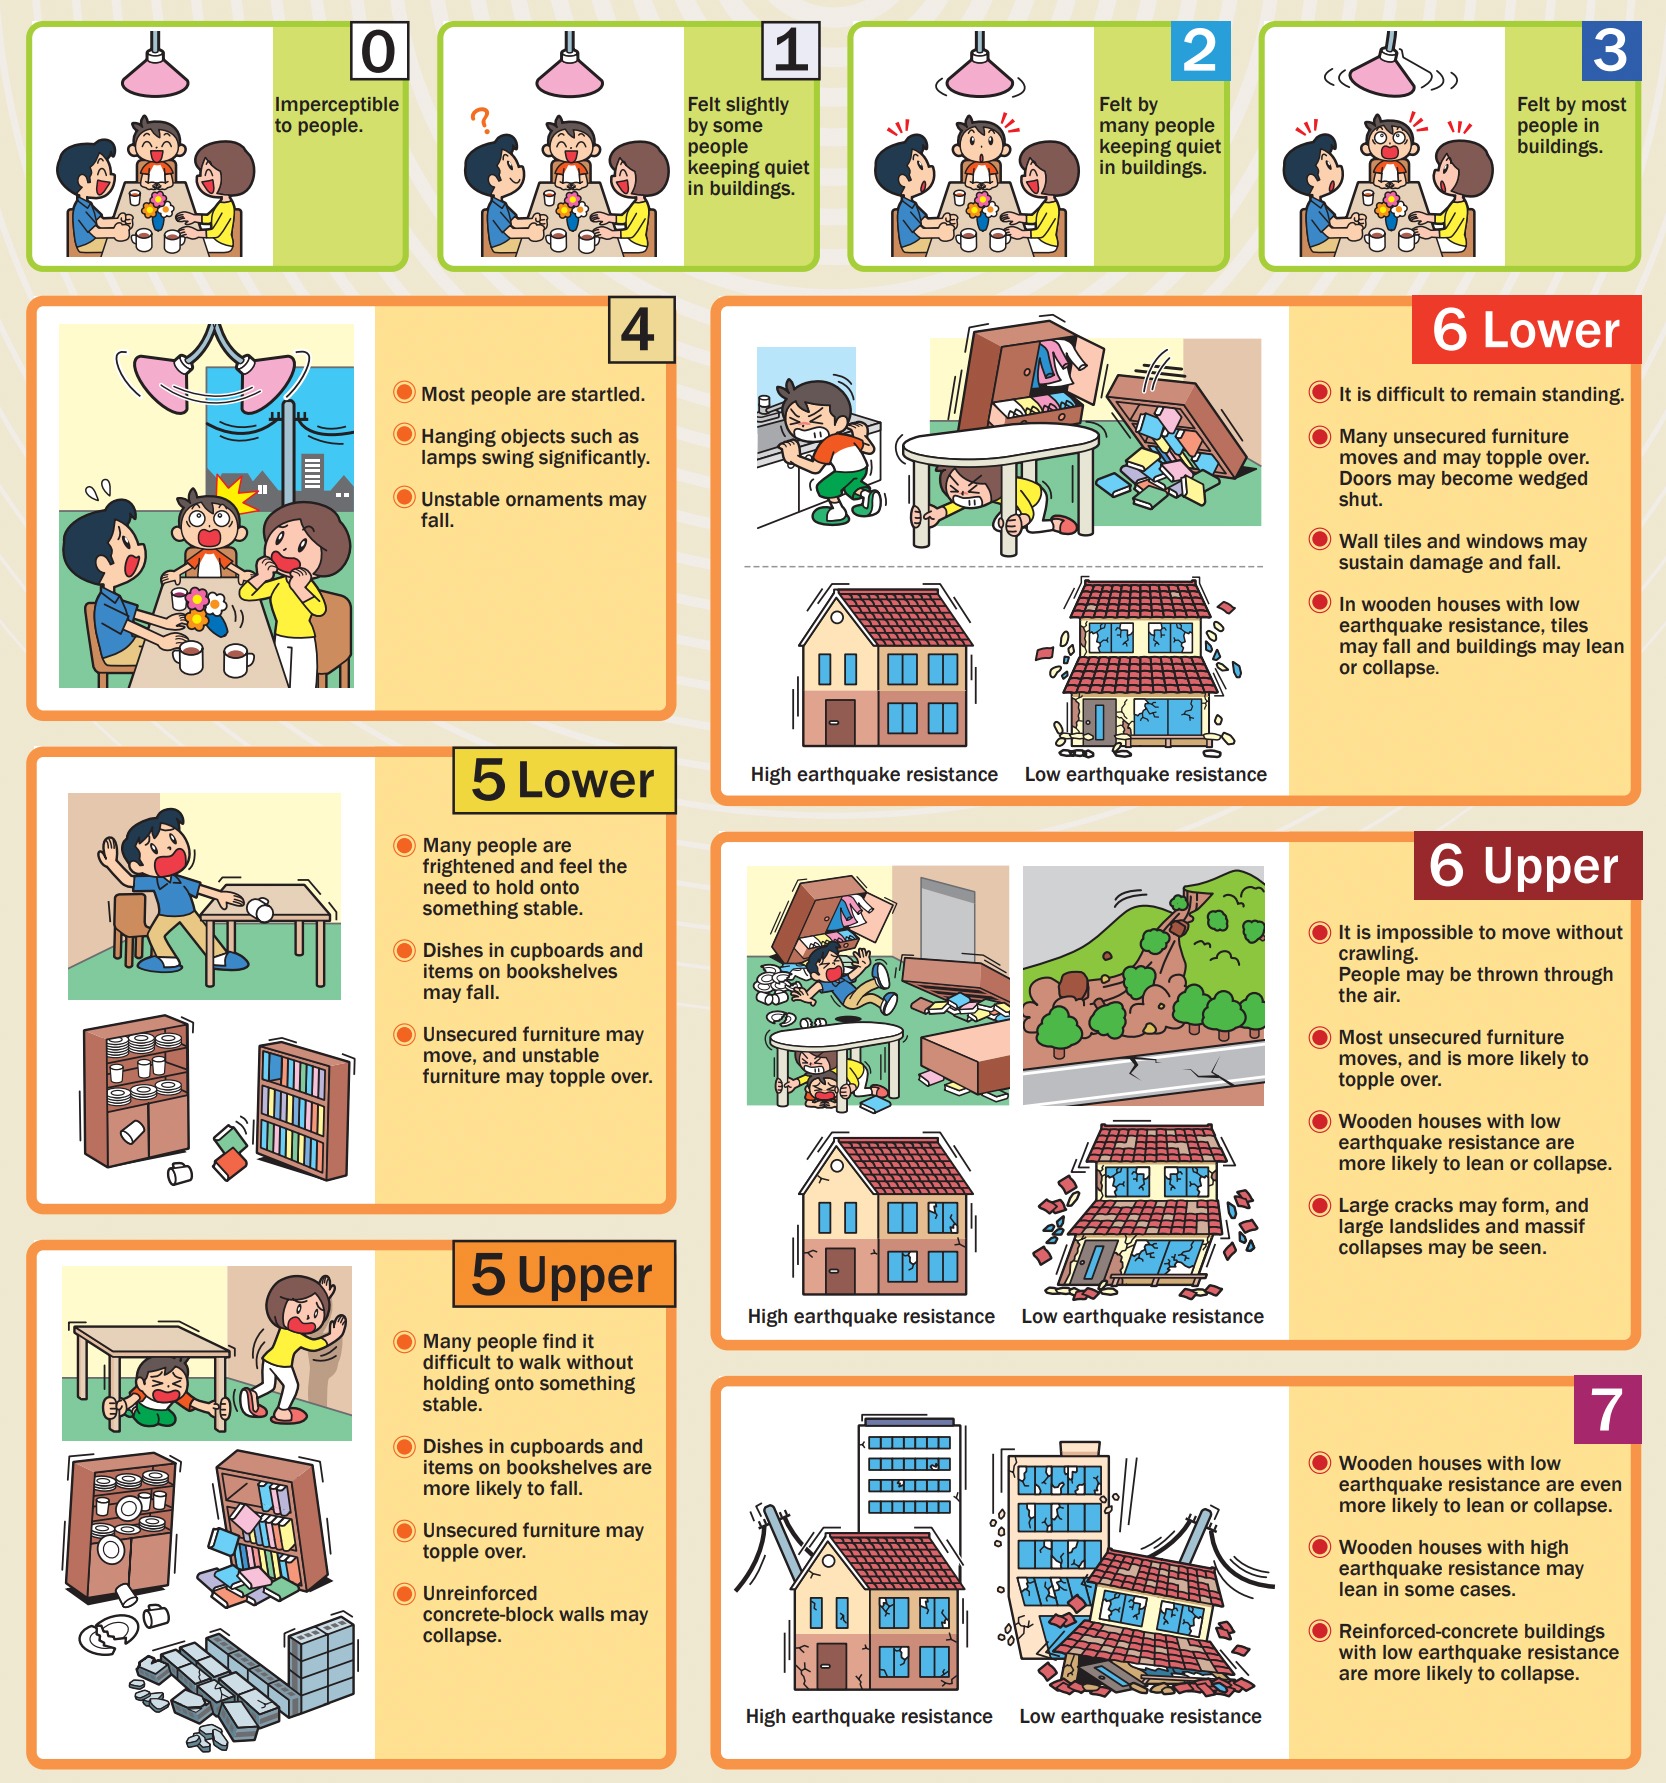
The scale describes typical conditions associated with each intensity level rather than guaranteeing a particular amount of damage. Building construction, the character and duration of the shaking, and local ground conditions can all affect what happens at an individual location.
What the applications reveal
Placed side by side, the layers resist a tempting shortcut: recent earthquakes are not a preview of the long-term forecast, and a shaking forecast is not a complete picture of risk. Recent events, tectonic structure, shaking probability, and population each describe a different part of Japan’s seismic landscape. The applications are most useful when those parts remain distinct but comparable.
Building the apps also made interaction part of the cartographic design. The constrained extent, time and magnitude filters, live summary statistics, translated legend labels, and swipe behavior all affect what users can understand and how quickly they can understand it. Balancing the detail of the source layers with performance and plain-language interpretation was the central challenge and the most rewarding part of the project.
Citations
Bird, P., & Ahlenius, H. (2020). Tectonic plates and boundaries [Feature service]. ArcGIS. https://www.arcgis.com/home/item.html?id=5113817f8b00453494fd5cf64c099ef9
Esri. (n.d.). ArcGIS Maps SDK for JavaScript [Software documentation]. https://developers.arcgis.com/javascript/latest/
Esri Japan. (2025). 全国都道府県界データ2025 [Japan prefecture boundaries 2025] [Feature service]. ArcGIS. https://www.arcgis.com/home/item.html?id=d473d15a95e1420c96e2063d48720ef3
Global Earthquake Model Foundation. (2020). Global active earthquake faults [Feature service]. ArcGIS. https://www.arcgis.com/home/item.html?id=37a384d4c1ef4f56a33a40f291a634e9
Japan Meteorological Agency. (n.d.). Tables explaining the JMA seismic intensity scale. https://www.jma.go.jp/jma/en/Activities/inttable.html
National Research Institute for Earth Science and Disaster Resilience. (2024). Probabilistic seismic motion forecast map: Maximum case [Map service]. ArcGIS. https://www.arcgis.com/home/item.html?id=6573181b486b45de9d9ead2956882905
U.S. Geological Survey, & Esri. (n.d.). Recent earthquakes [Feature service]. ArcGIS Living Atlas of the World. Retrieved August 19, 2026, from https://www.arcgis.com/home/item.html?id=9e2f2b544c954fda9cd13b7f3e6eebce
WorldPop. (2025). Global estimated population in 2020 [Image service]. ArcGIS Living Atlas of the World. https://www.arcgis.com/home/item.html?id=f76704c554ff40daa6df16e5e2e79133
Categories: Mapping, Scripting and development