Bathymetry describes the shape and depth of underwater terrain. This project treated it as raw material for a cartographic experiment: turning the seafloor east of Japan’s Ogasawara (Bonin) Islands into a stylized, almost architectural stack of contour slices.
Choosing the study area
The Ogasawara Arc is a volcanic island arc system in the western Pacific and part of the larger Izu–Ogasawara–Mariana (IBM) arc system.
I selected the study area (21°–28° N, 143°–151° E) by visually scanning Esri’s Oceans basemap for underwater terrain that might respond well to an exaggerated vertical treatment. Its steep trench walls, volcanic ridges, and clusters of seamounts looked like they could produce a dramatic contour image.
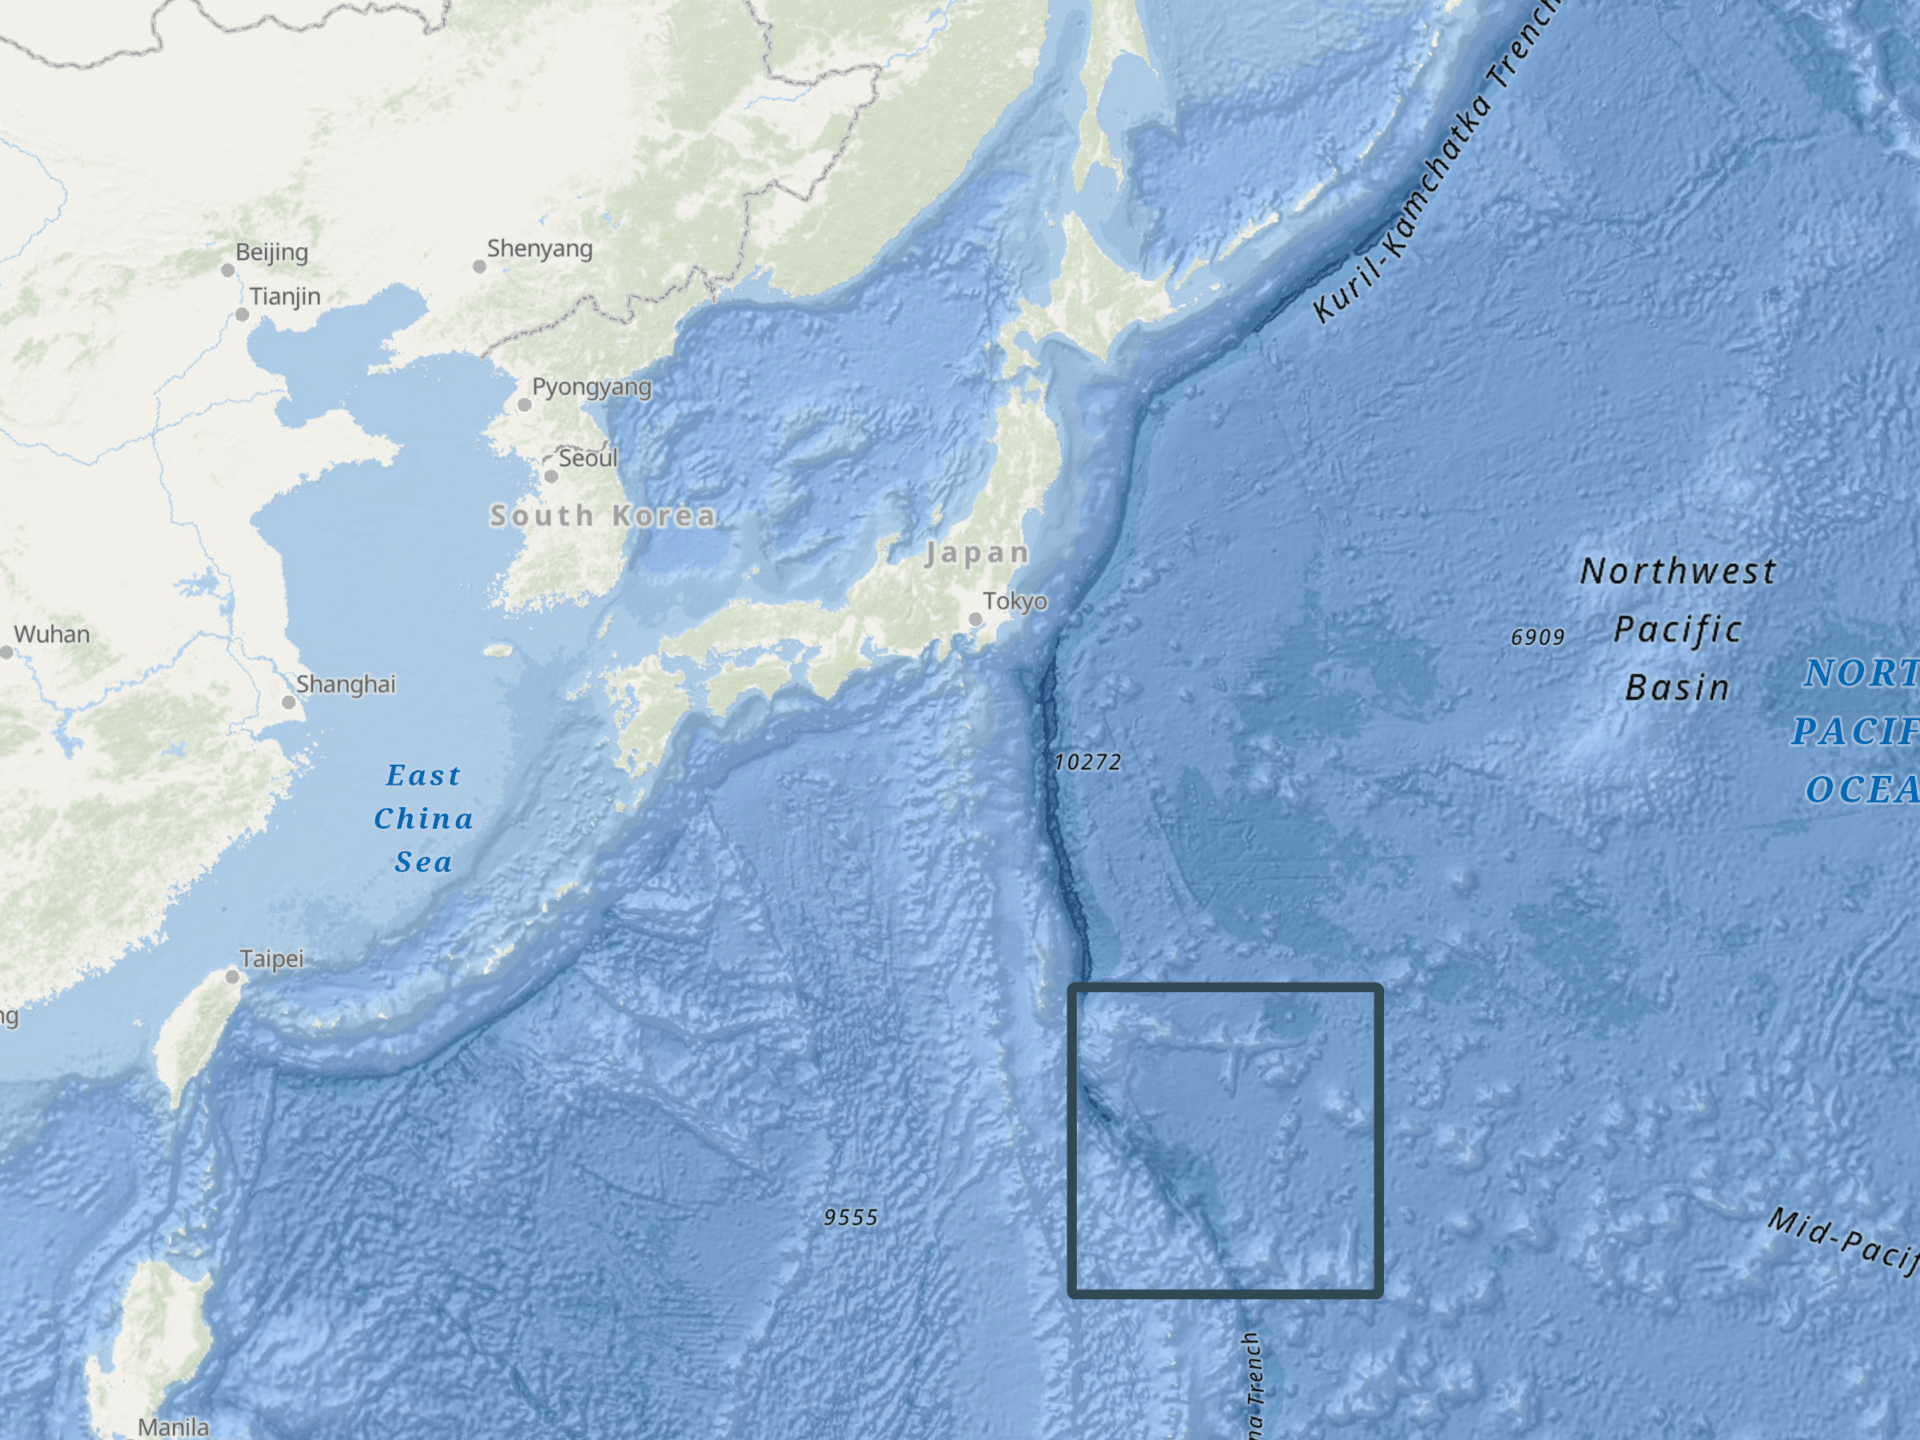
The study area selection was driven by visual potential rather than a geological research question. This project was, at heart, an exercise in cartography.
Building the isometric effect
The source surface was a subset of the GEBCO_2025 Grid, a global terrain model that provides elevation values in meters on a 15-arc-second grid. GEBCO combines measured and estimated seafloor information, so the raster is better understood as a gridded terrain model than as a collection of raw depth soundings. Within the downloaded subset, depths ranged from 80 to 9,314 meters below sea level. Before processing, the grid was projected to WGS 1984 / UTM Zone 55N (EPSG:32655).
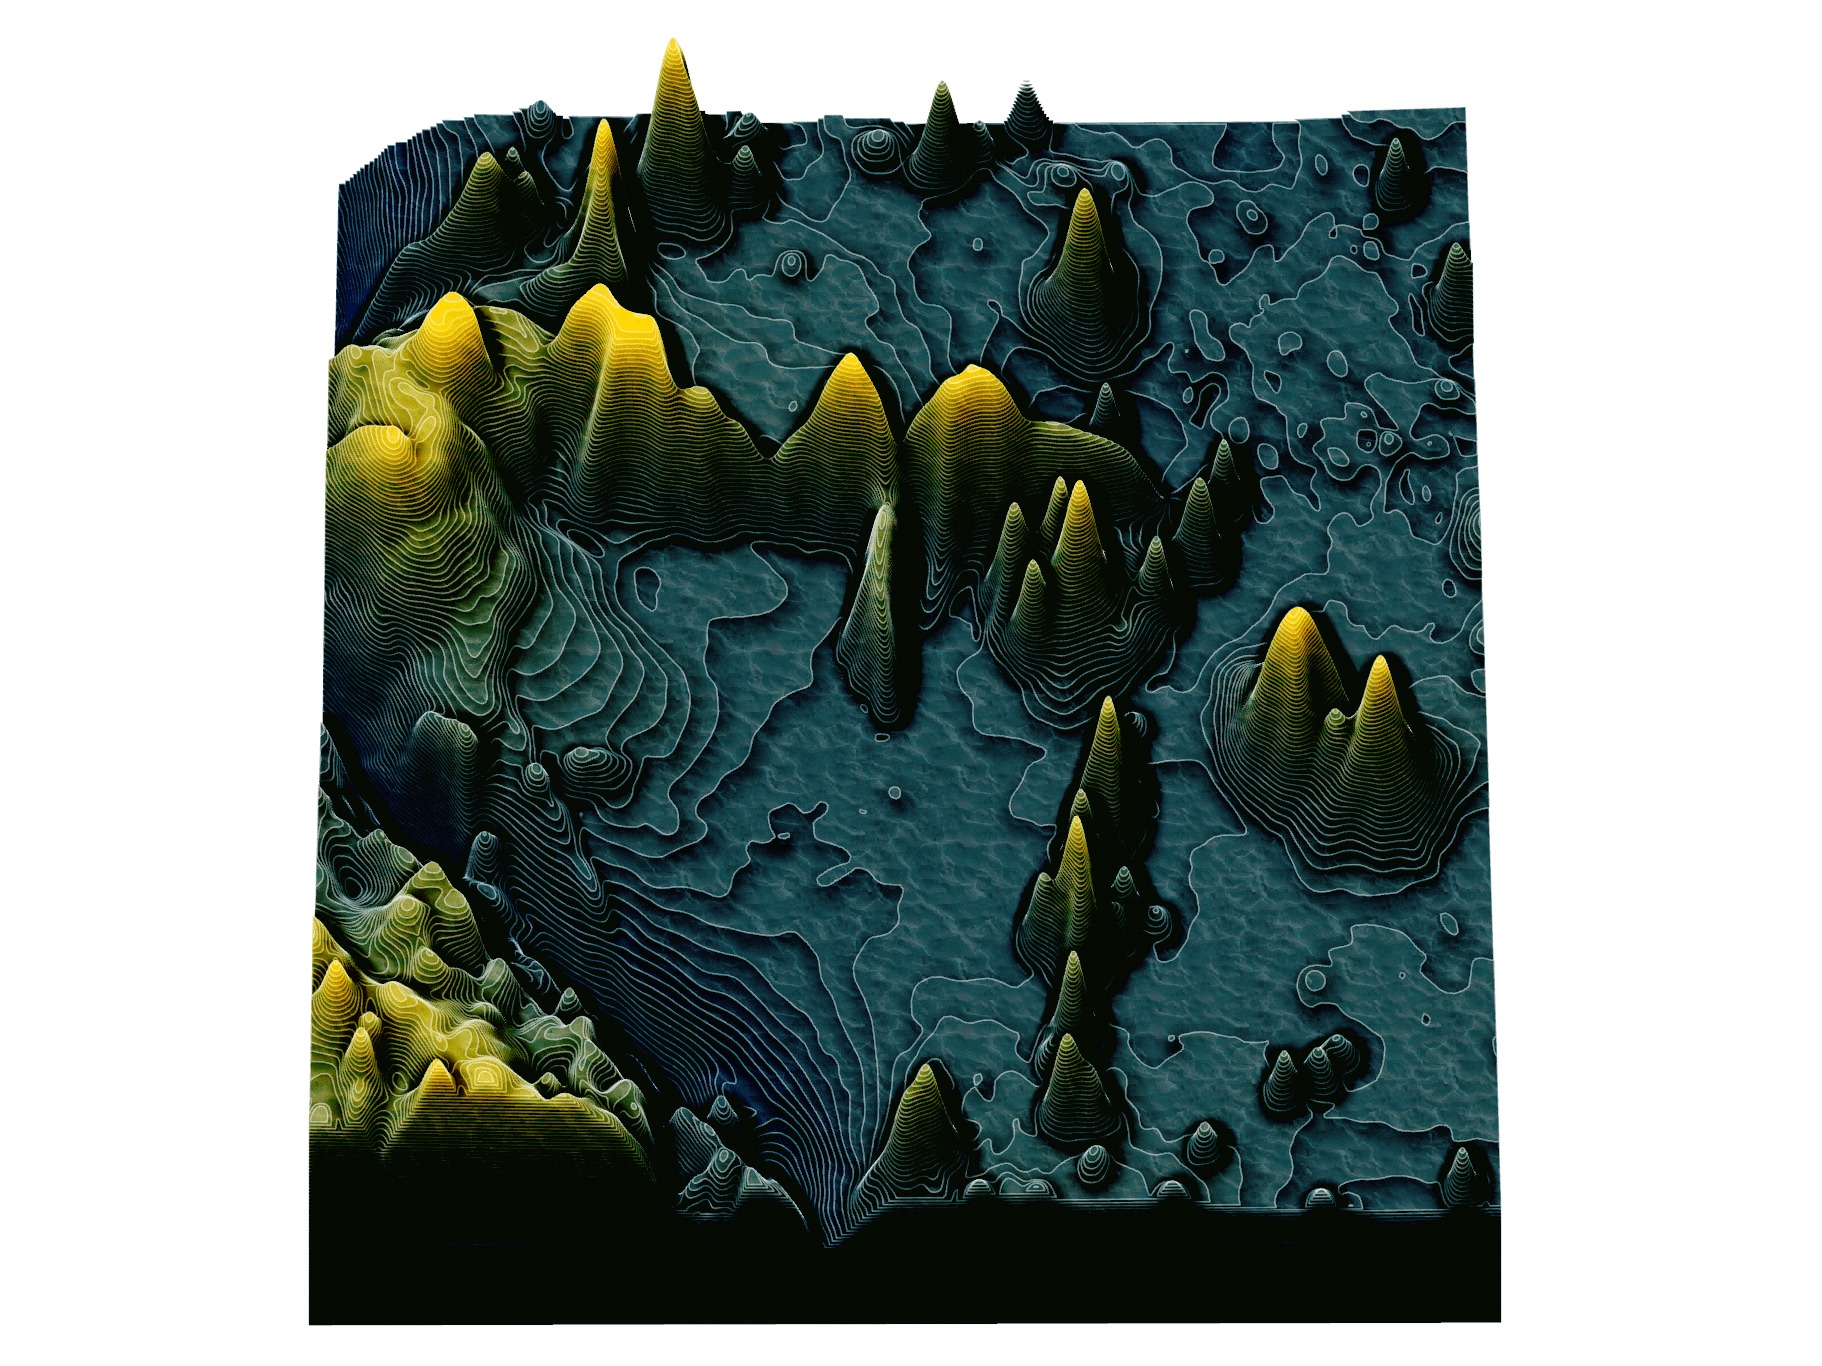
Following John Nelson’s Bathymetry Slices tutorial, the raster was generalized and converted to contours in ArcGIS Pro. Move effects shifted the contour layers vertically according to depth, creating the appearance of stacked underwater relief within an otherwise two-dimensional map. A lighting overlay further strengthened the sense of relief.
Designing depth
The workflow established the structure, but the styling gave the map its mood. A deep-teal-to-yellow gradient distinguishes depth, while shading and lighting effects strengthen the apparent relief. Stacked water-texture layers add variation to the darker portions of the surface.
The tutorial supplied the method; the study area and final balance of color, shading, and texture were specific to this map. The result is less a conventional bathymetric reference map than a deliberately exaggerated interpretation that remains anchored to the elevation data.
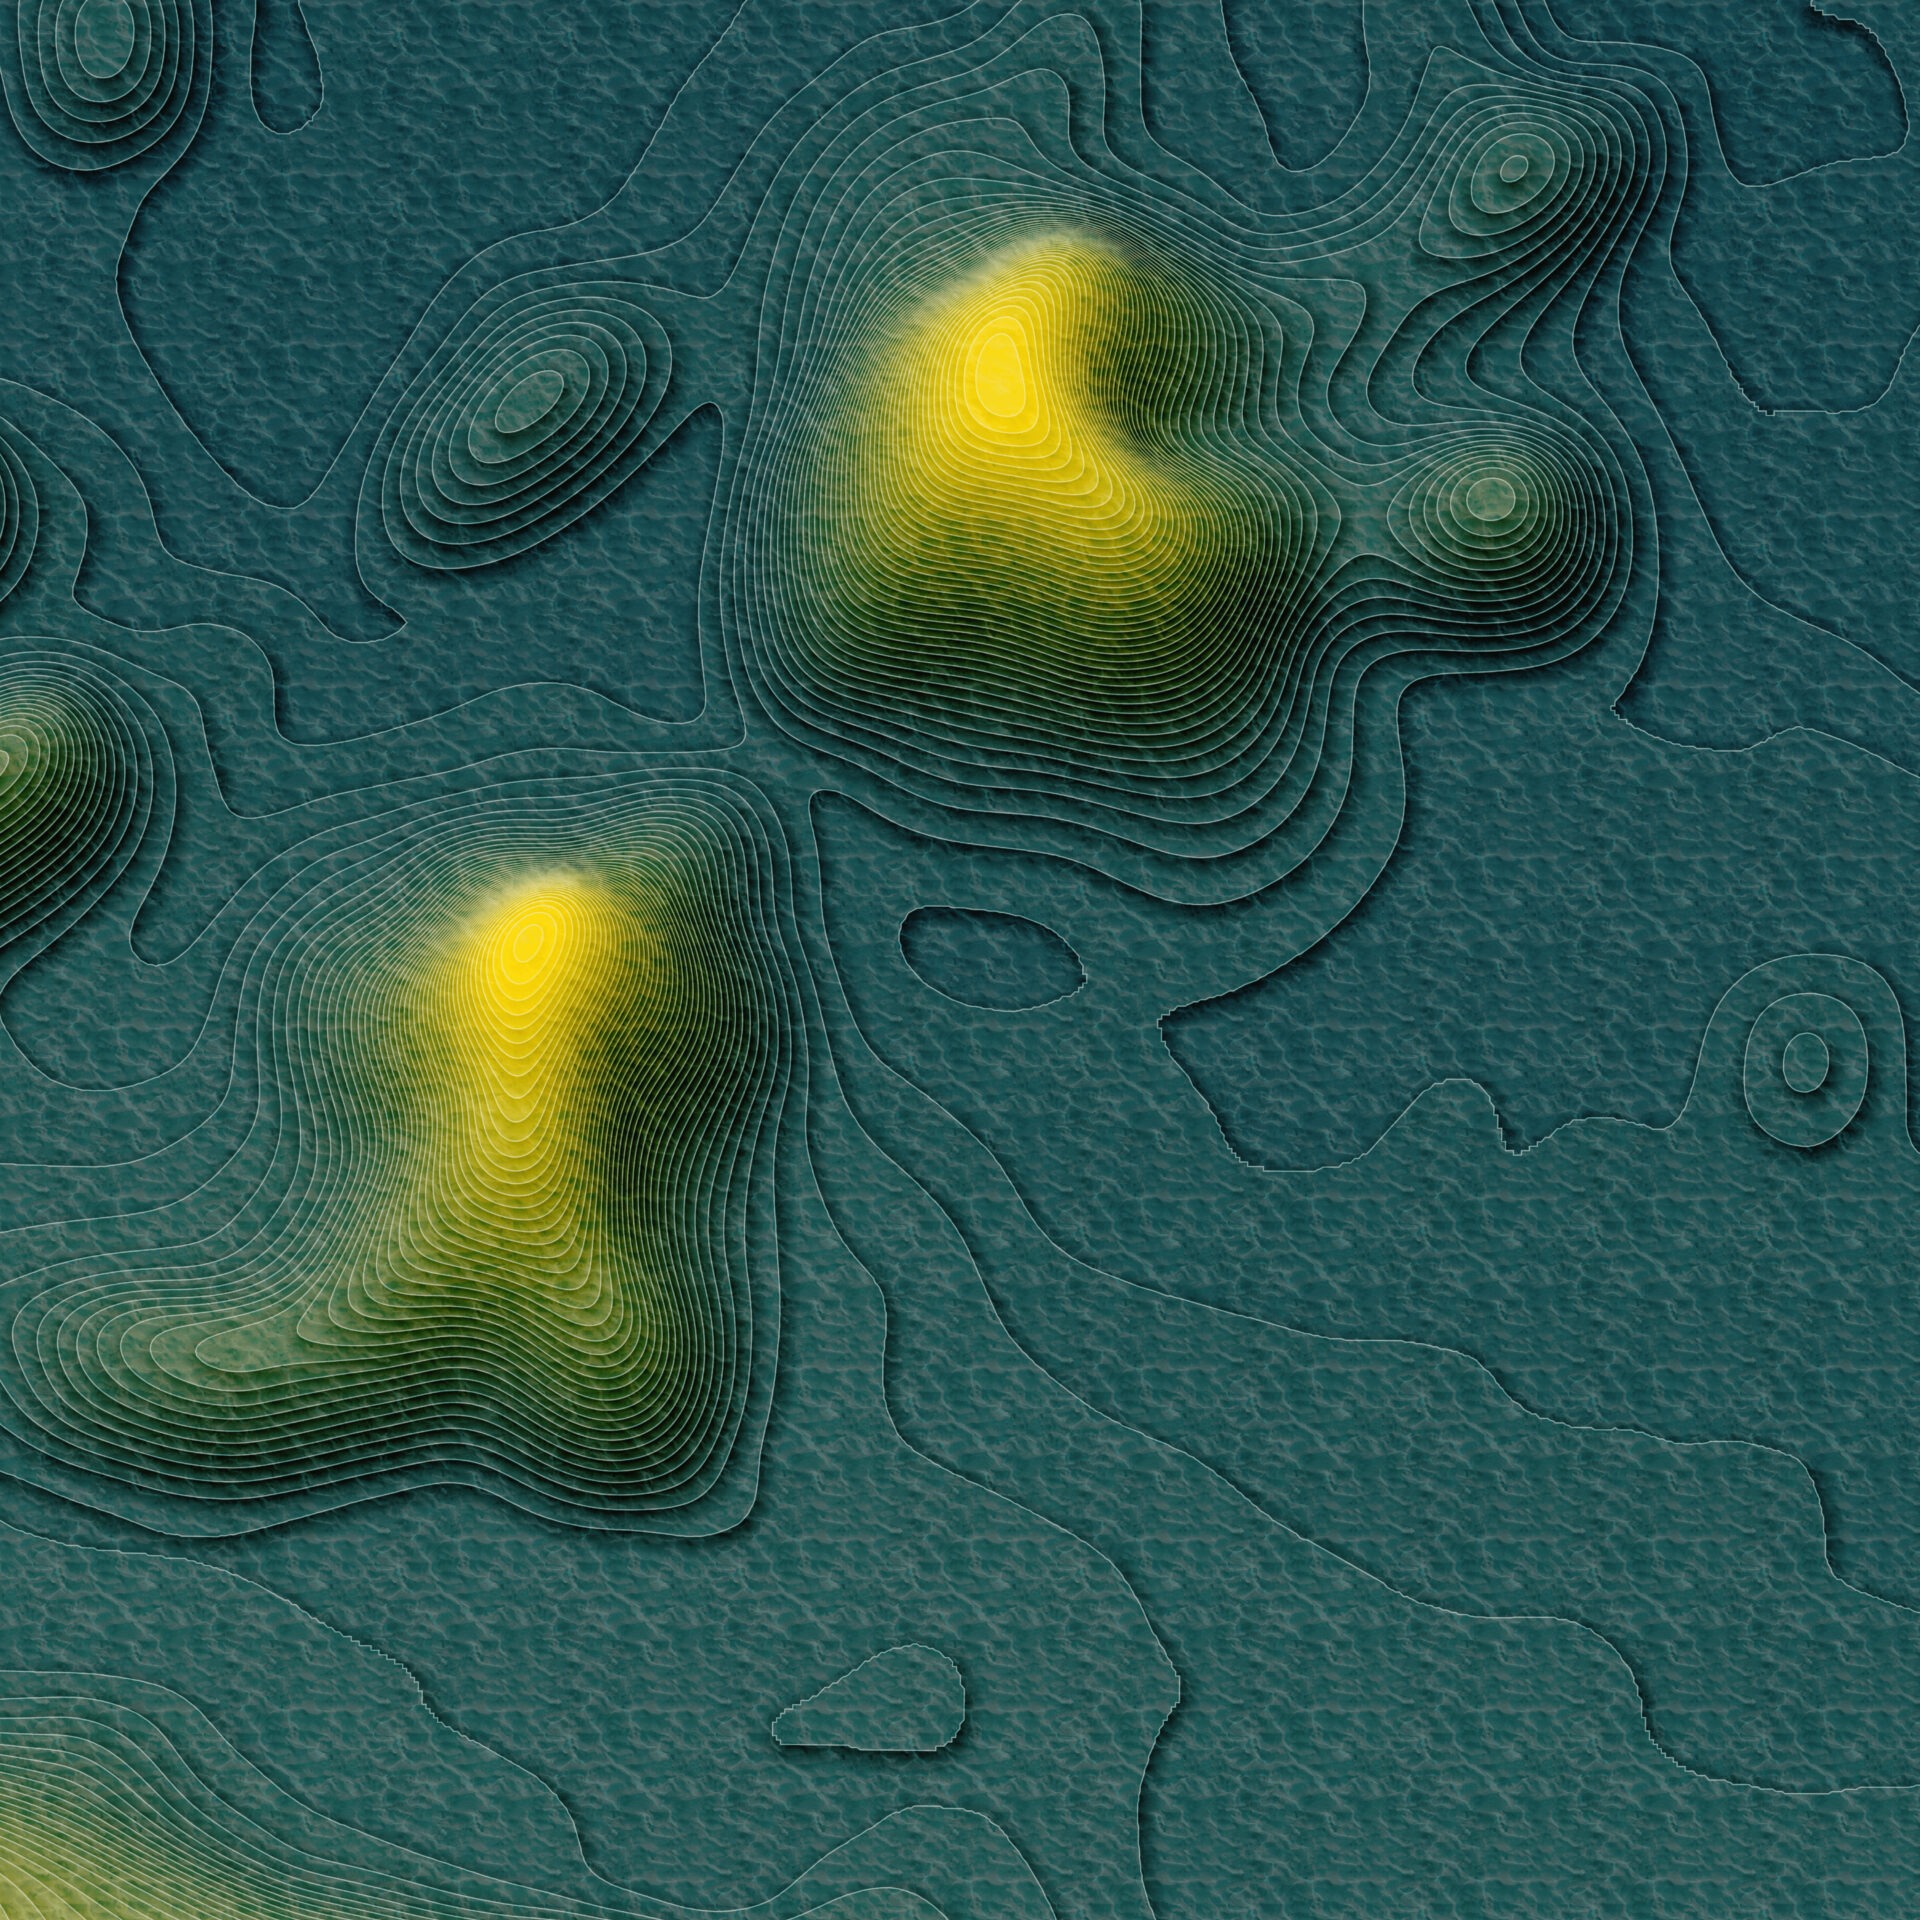
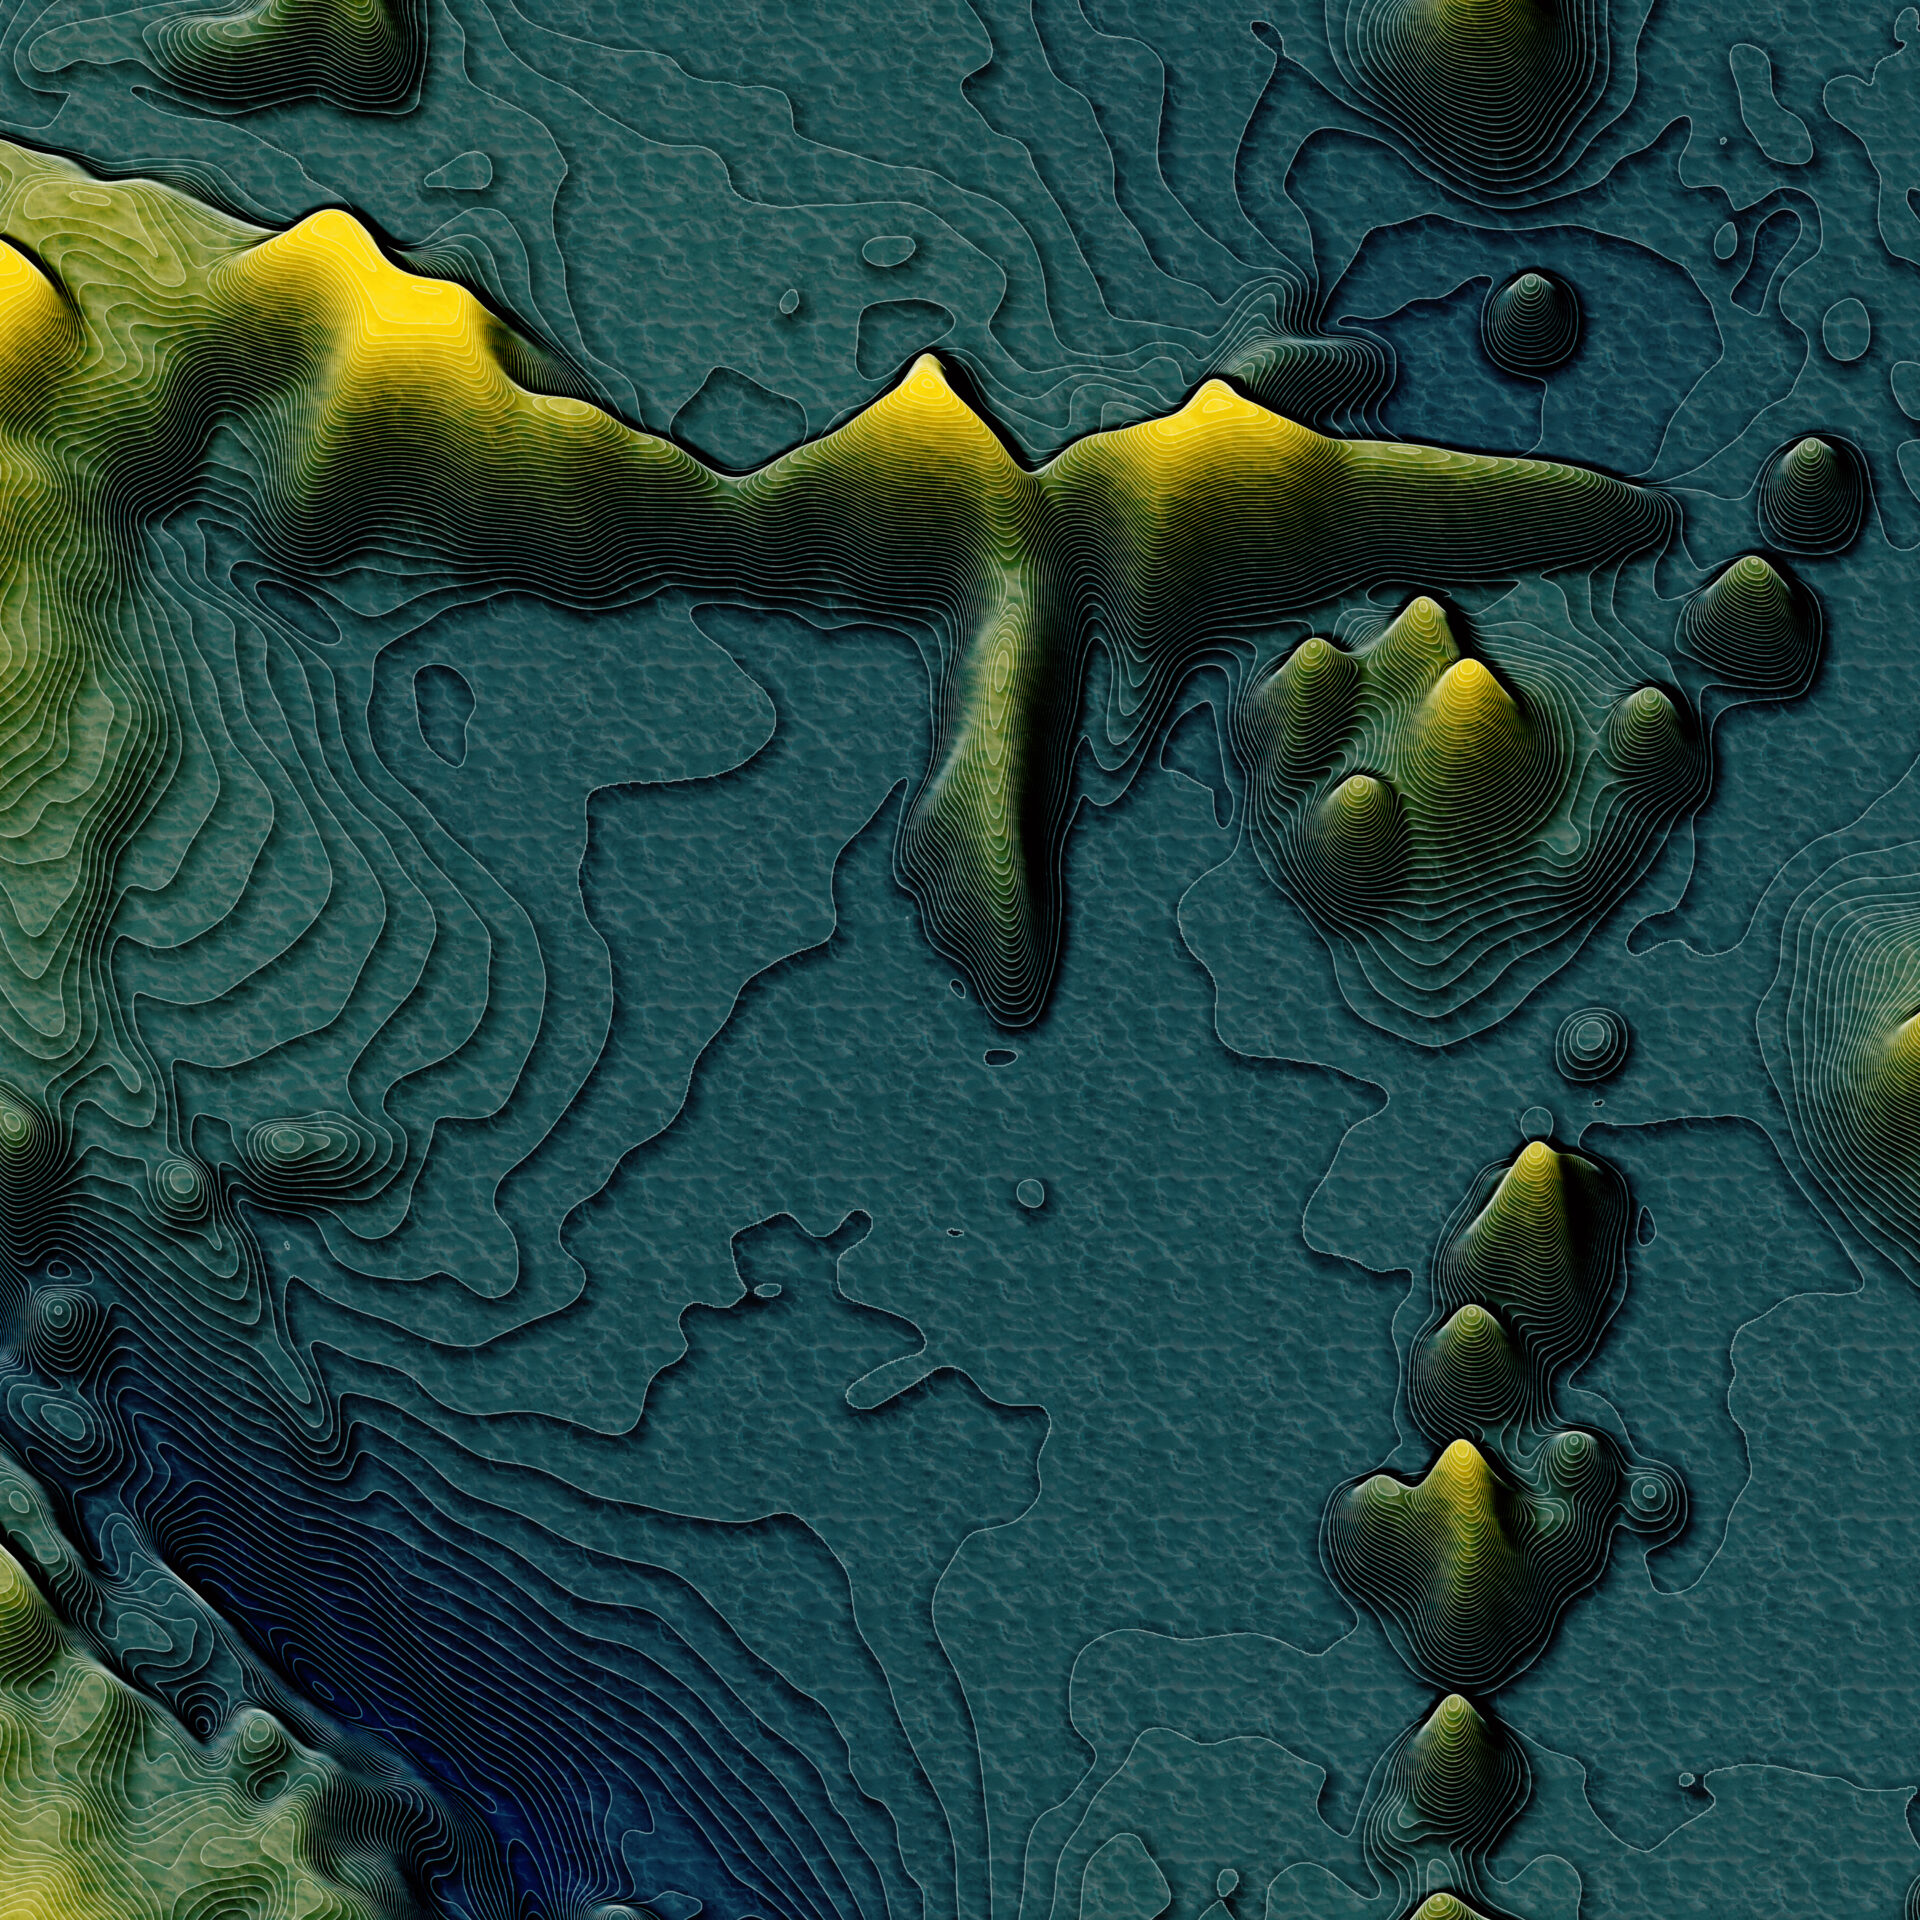
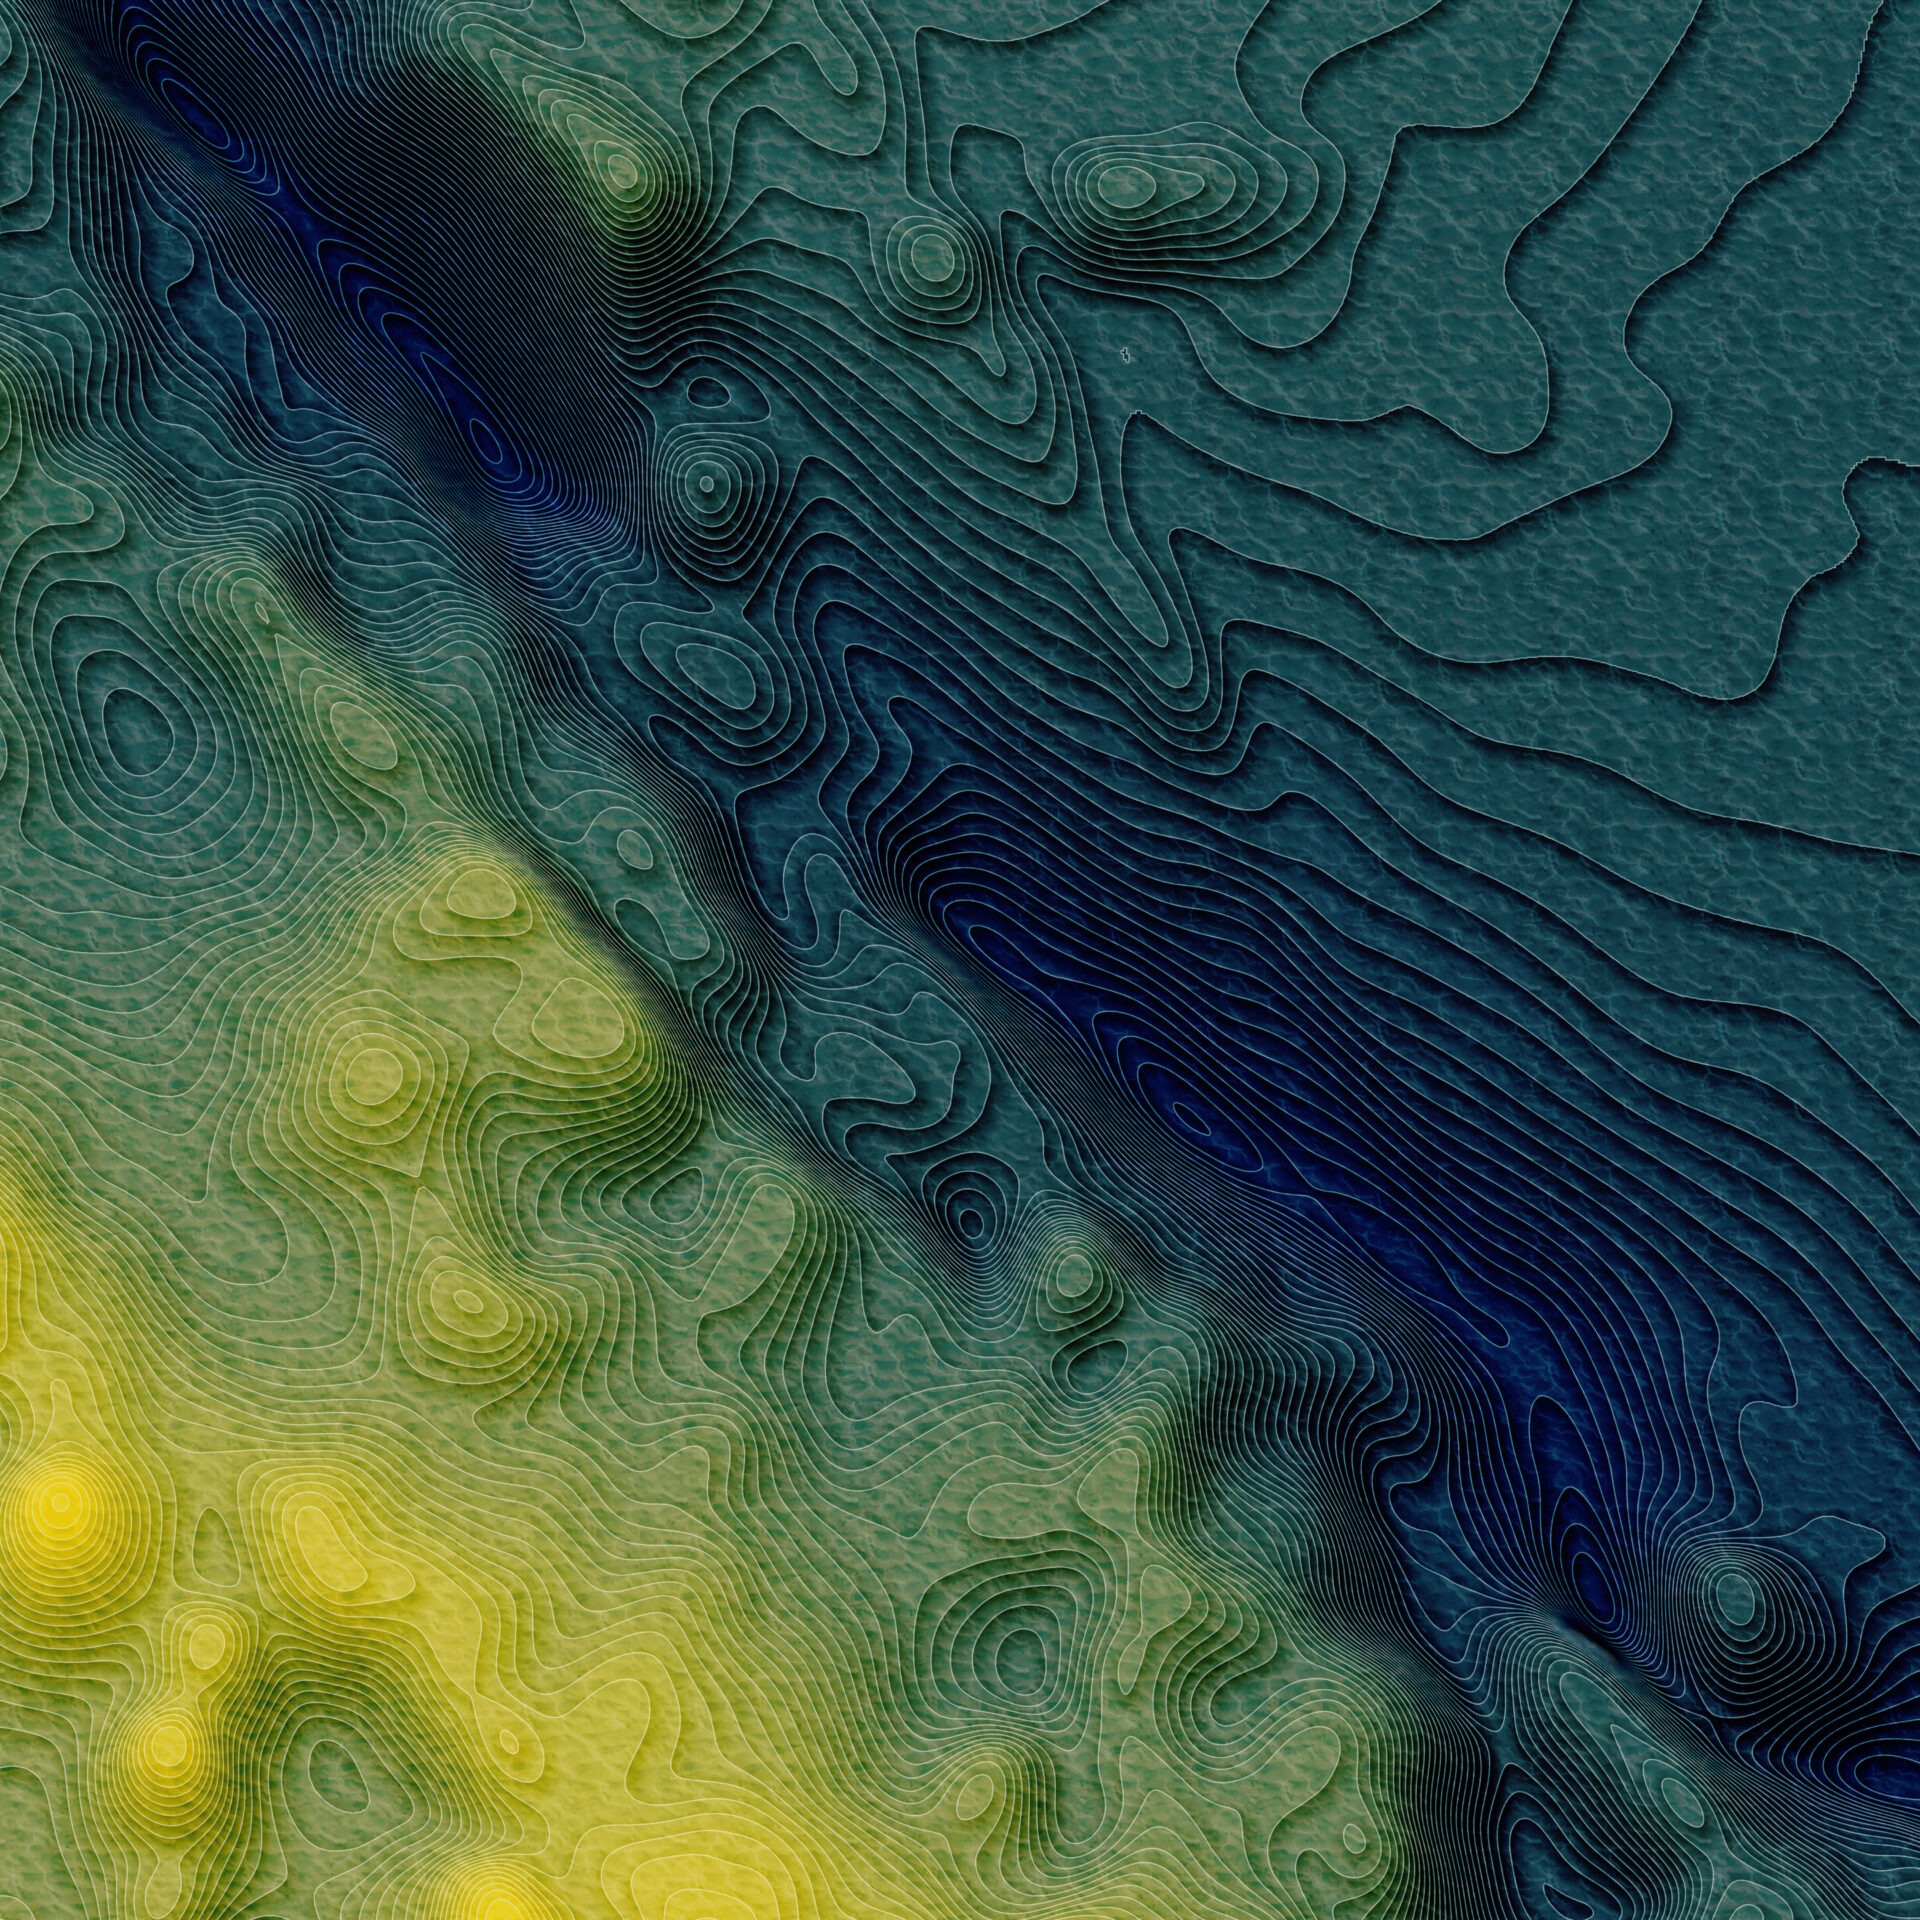
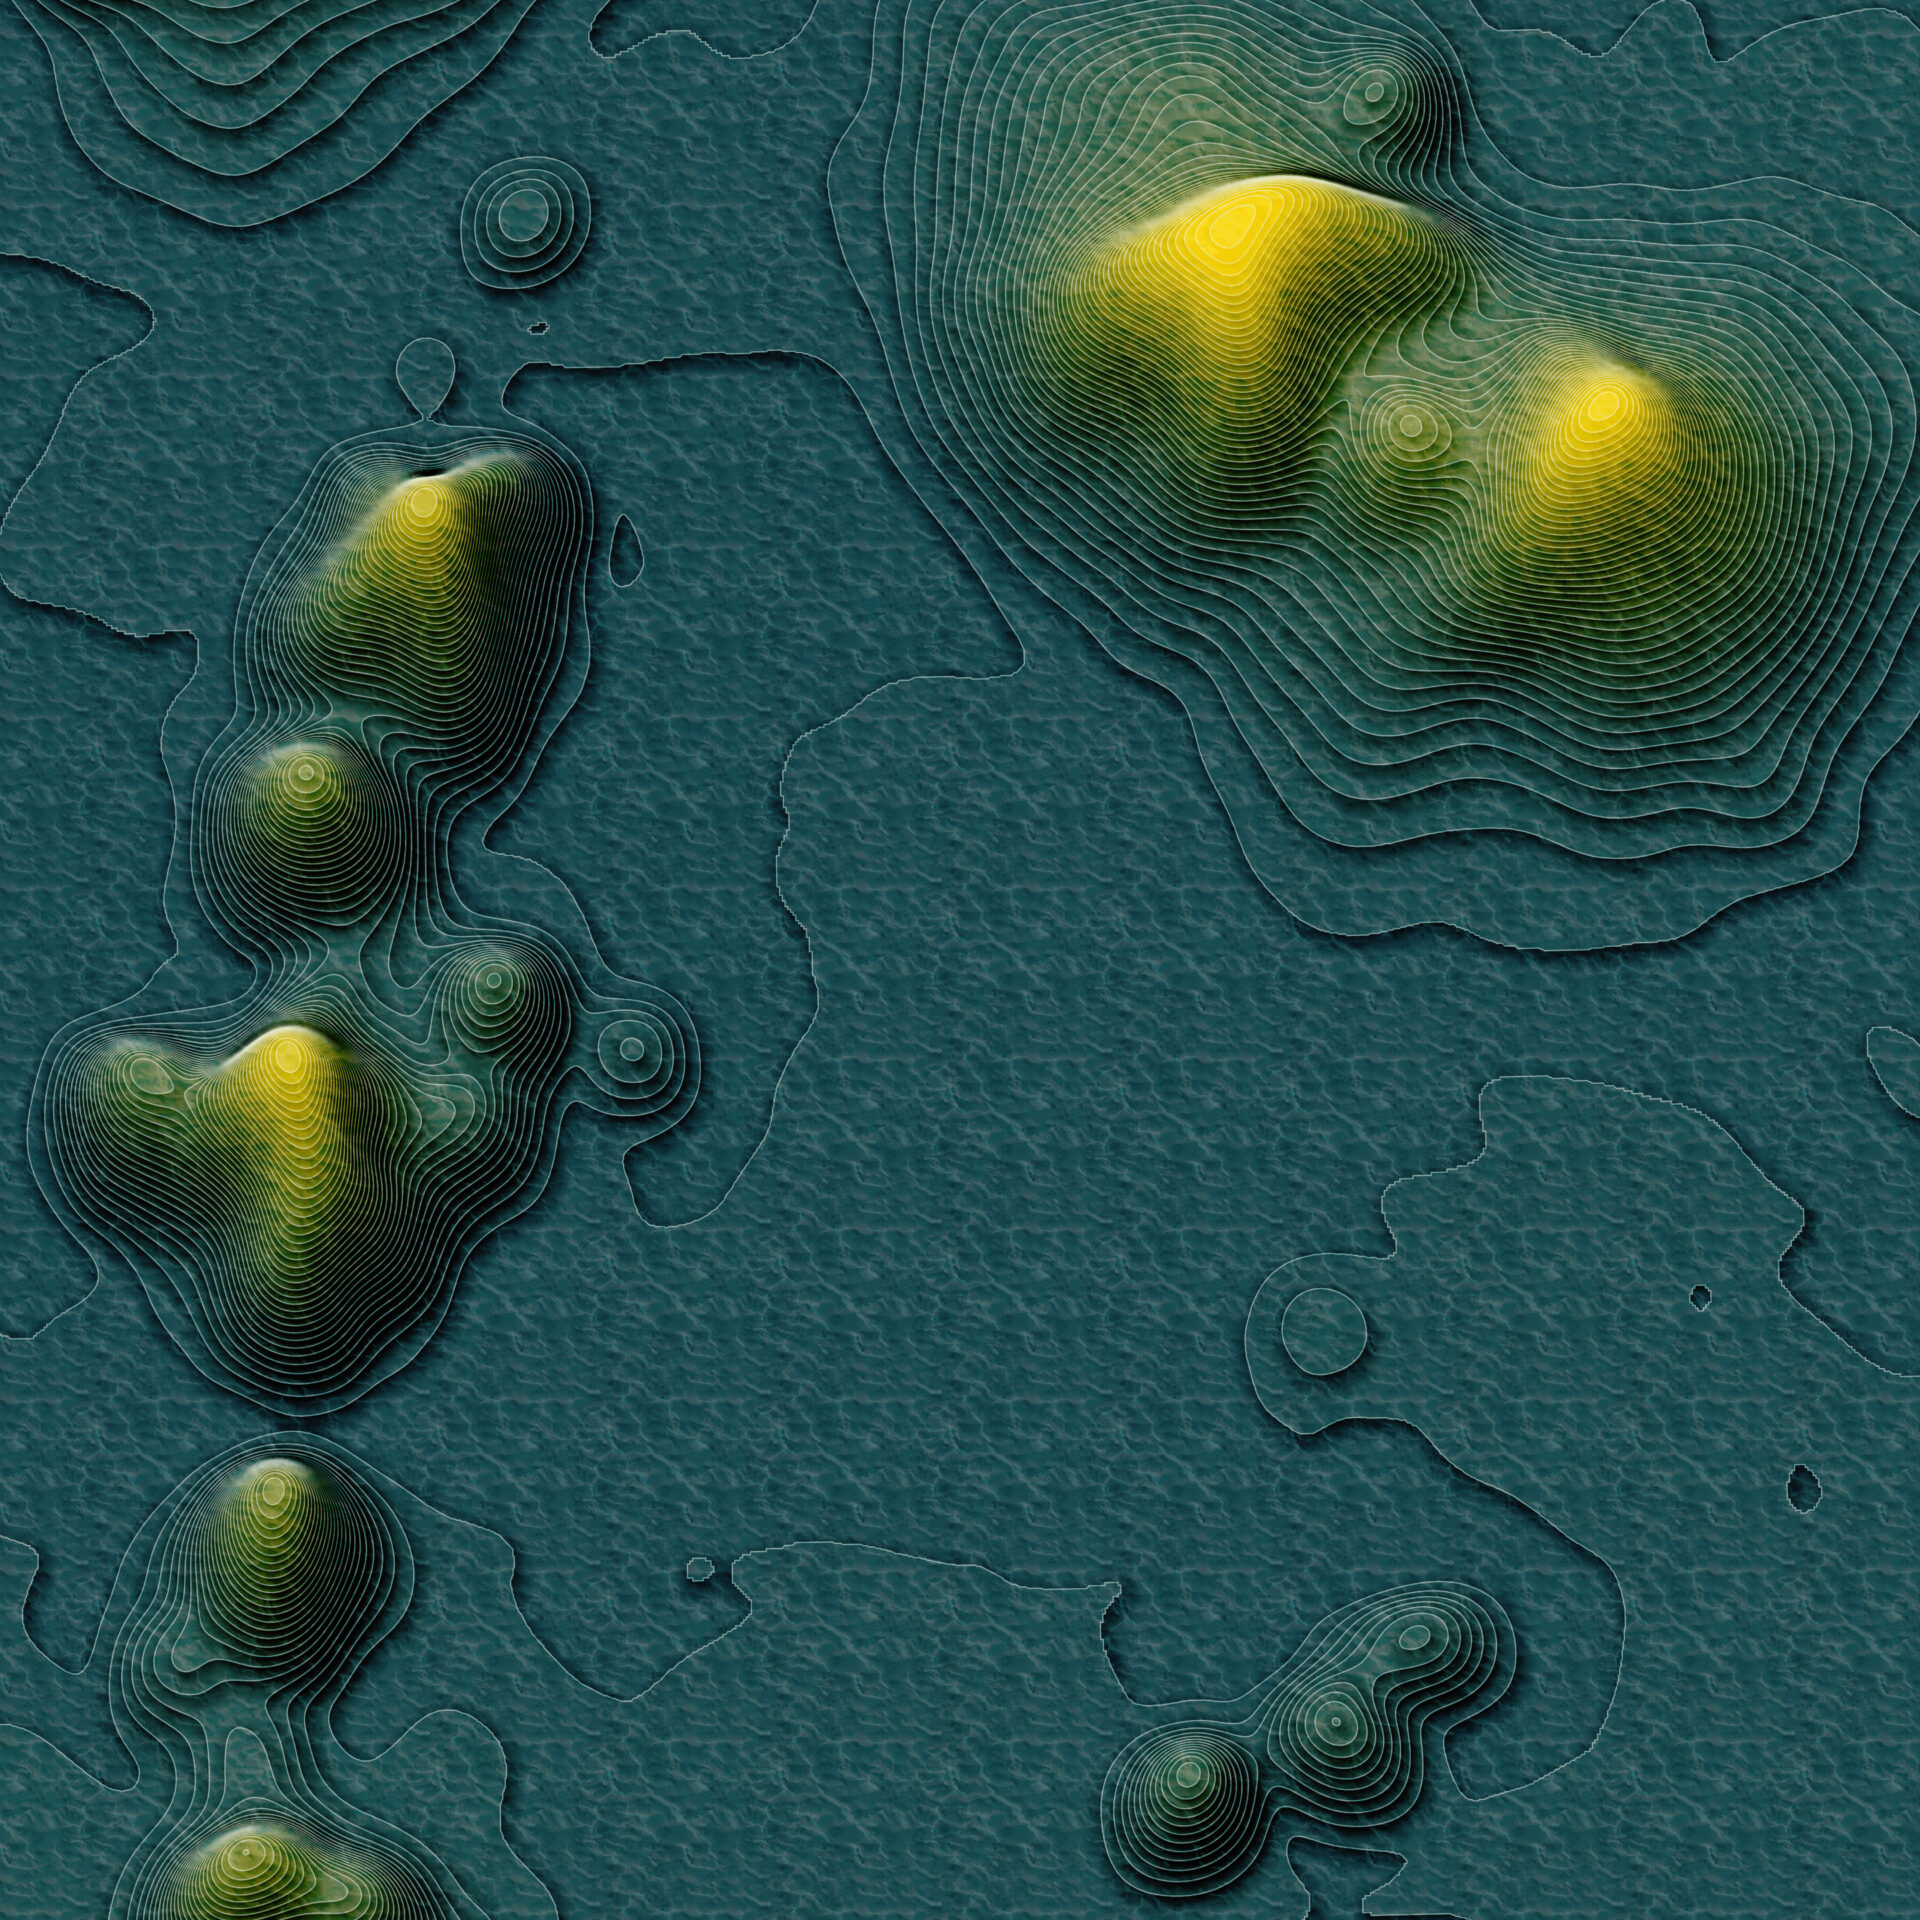
This exercise expanded my use of ArcGIS Pro beyond default symbology, particularly through layer effects, gradients, and texture stacking. It also demonstrated how convincingly a flat map can suggest depth without becoming a true 3D scene. The seafloor never actually left the page, but visually it made a respectable attempt.
Credits
Method adapted from John Nelson’s Bathymetry Slices tutorial.
Bathymetric terrain data: GEBCO Compilation Group (2025), GEBCO 2025 Grid.
Orientation map: Esri Ocean Basemap.
Categories: Mapping