Most of the reported industrial air releases in St. Louis County come from only a handful of facilities. Those facilities sit within a county whose racial demographics also change sharply from tract to tract. This project maps the two patterns separately, combines them in a bivariate map, and then examines whether they move together across the county.
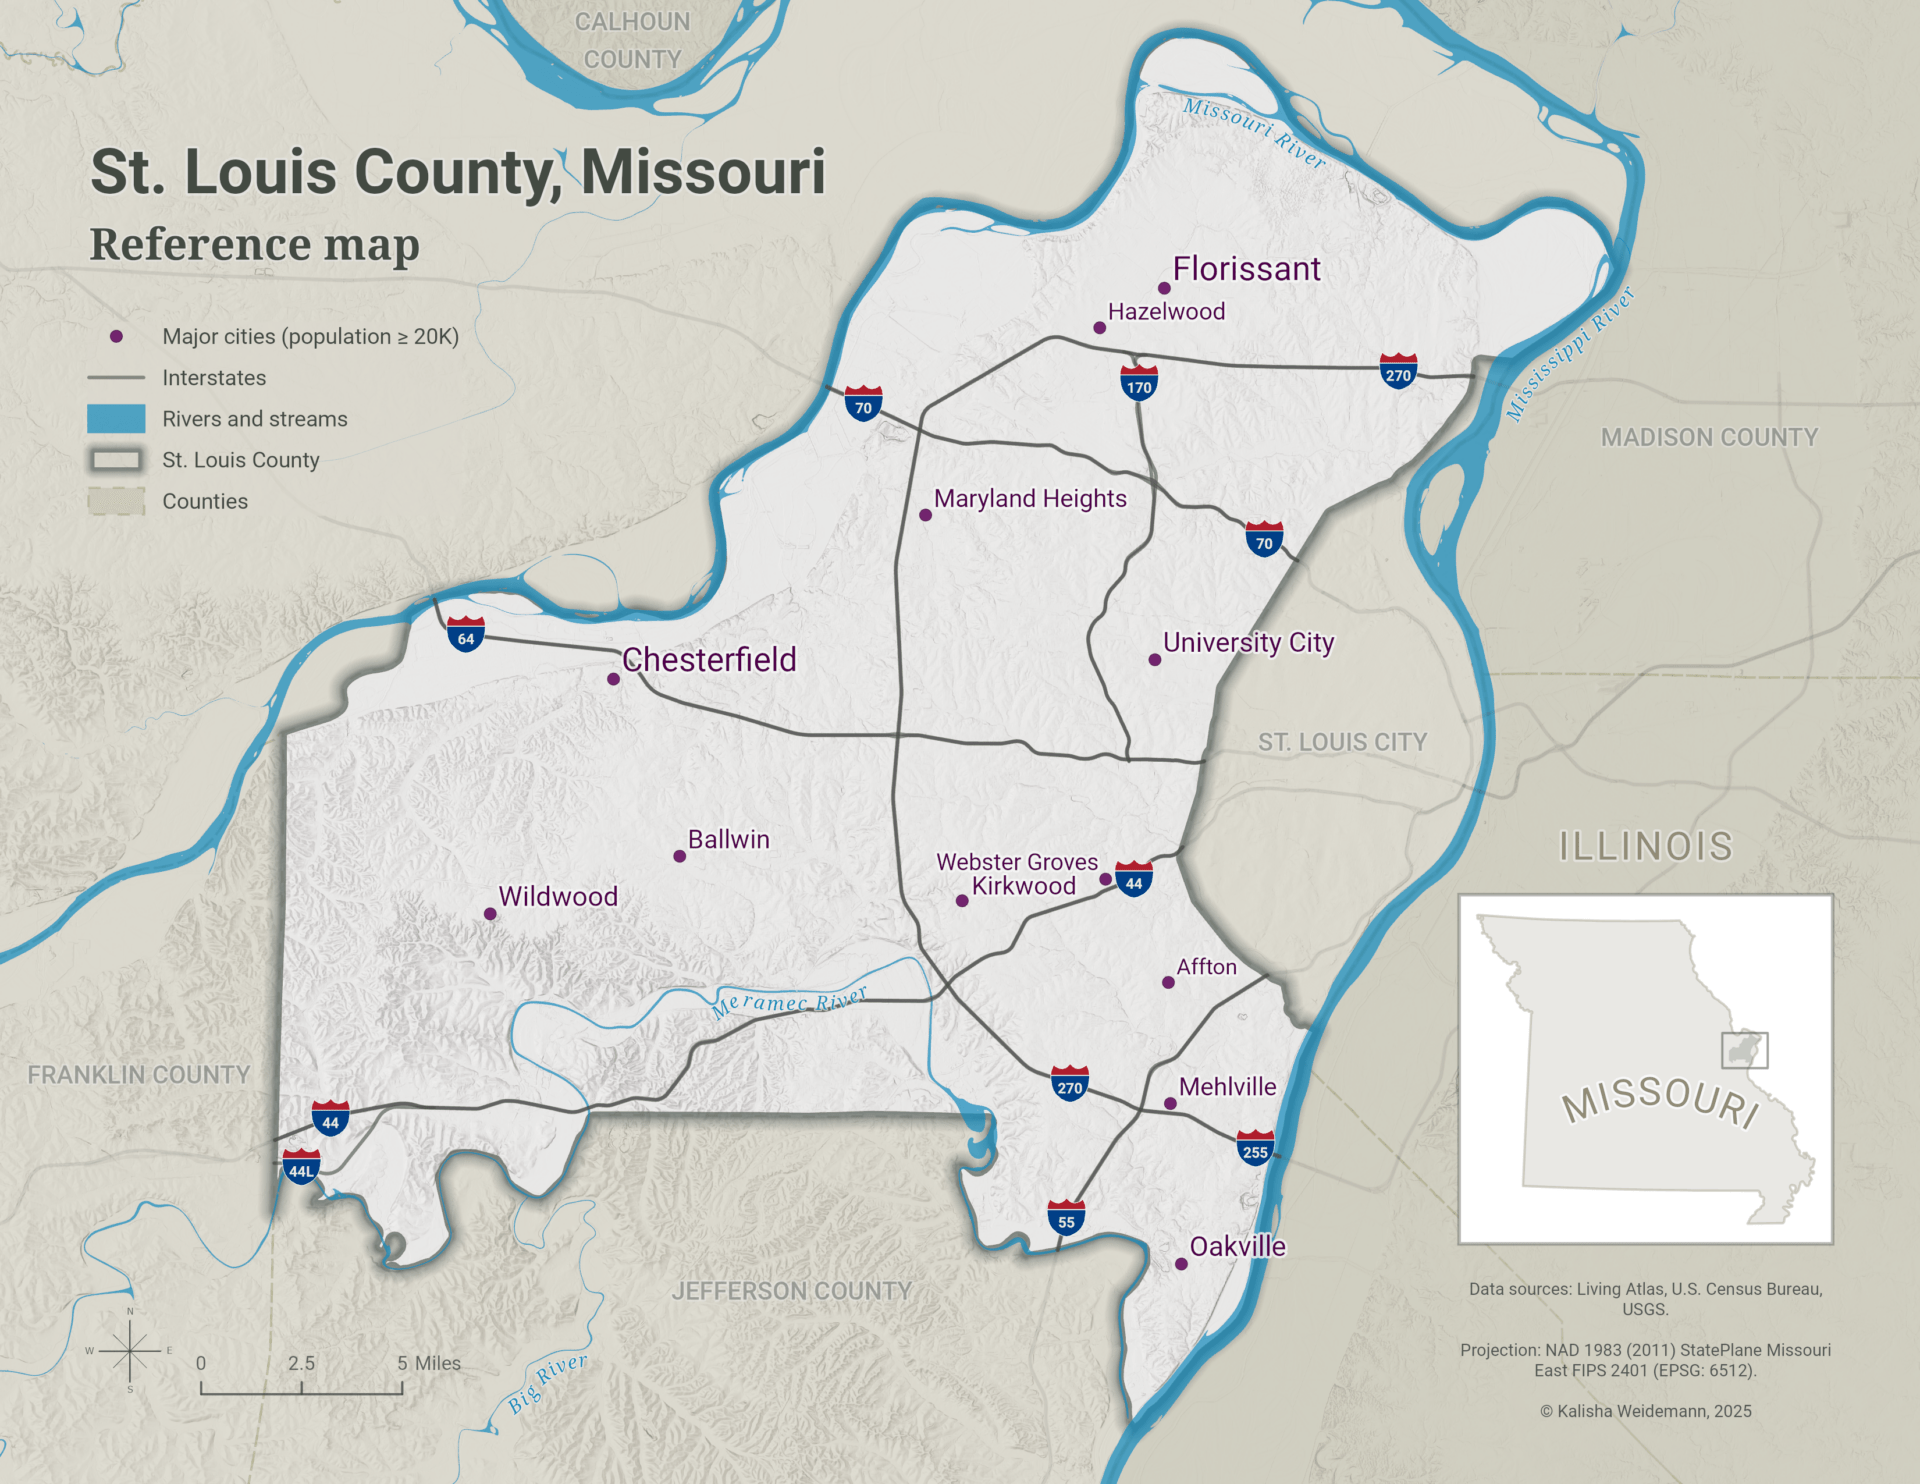
St. Louis County wraps around the western side of independent St. Louis City, between the Missouri and Mississippi rivers. The analysis used 2023 EPA Toxics Release Inventory data and 2019–2023 American Community Survey estimates. Because the TRI records releases rather than ambient concentrations, the maps show where reported emissions originated, not how pollutants dispersed or who was exposed.
The county’s relief is easy to overlook beneath the demographic and emissions data. As a separate cartographic study, I followed a workflow developed by John Nelson to create a stacked-contour visualization emphasizing the transition from the Mississippi River floodplain to the higher terrain of the Ozark foothills in the southwest.
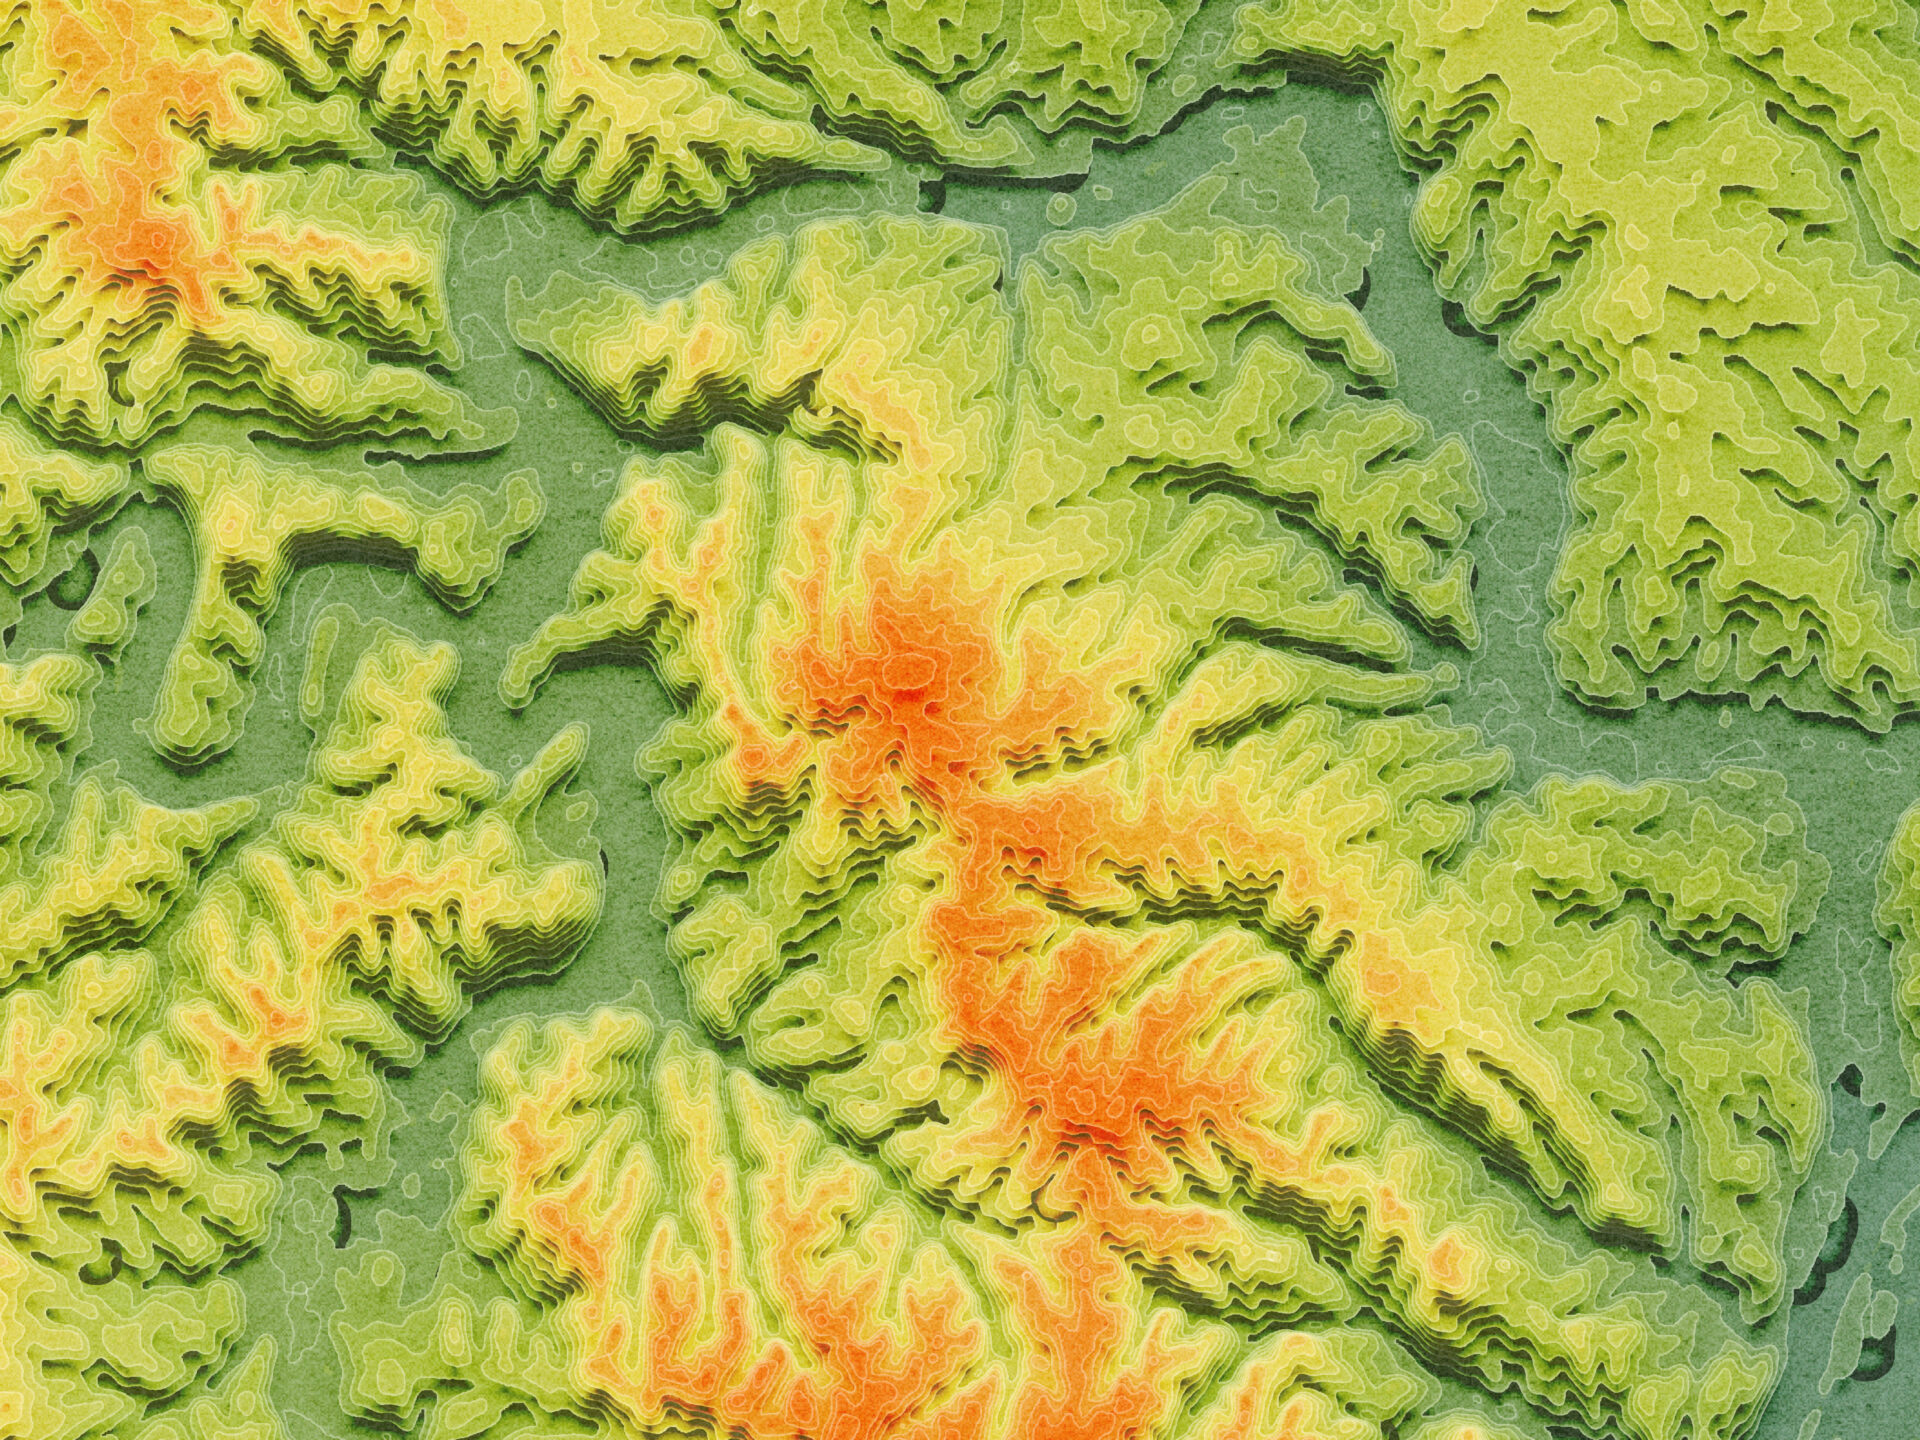
The terrain image provides geographic context; it was not used in the pollution analysis.
Data and analytical approach
| Layer | Source | Dataset or service |
|---|---|---|
| Toxics Release Inventory (TRI) | EPA | TRI Basic Data Files: Calendar Years 1987-Present |
| Roads | U.S. Census Bureau | TIGER/Line Shapefiles |
| Rivers and streams | Esri and USGS | National Hydrography Dataset Plus High Resolution |
| Major cities | Esri | USA Major Cities |
| Urban areas | Esri | USA Census Urban Areas |
| Census tracts and demographics | Esri | ACS Race and Hispanic Origin Variables – Boundaries |
| Counties | Esri | USA Census Counties |
| States | Esri | USA Census States |
| Hillshade | USGS | USGS 3DEP 10m National Map Seamless |
All spatial data were accessed in September 2025, clipped to St. Louis County, and projected to NAD 1983 (2011) StatePlane Missouri East FIPS 2401 (Meters), EPSG:6512.
For each TRI facility, fugitive releases from leaks, equipment, and storage were combined with stack releases from smokestacks or vents. Facility totals were then summed within census tracts for comparison with demographic data.
Minority population was calculated as the percentage of residents identifying as any race or ethnicity other than non-Hispanic White. All comparisons were conducted at the census-tract level to maintain a consistent spatial scale.
Where reported air releases are concentrated
The EPA Toxics Release Inventory requires certain industrial facilities to report annual releases of listed chemicals. The graduated-symbol map shows the combined volume of fugitive and stack emissions reported by each participating facility in 2023.

A few large industrial sites account for much of the mapped release volume. Most tracts contain no TRI-reporting facility or only facilities with relatively small release totals, while several locations stand out as pronounced emissions outliers.
Where minority populations are concentrated
The 2019–2023 American Community Survey estimates show substantial demographic variation among St. Louis County census tracts.
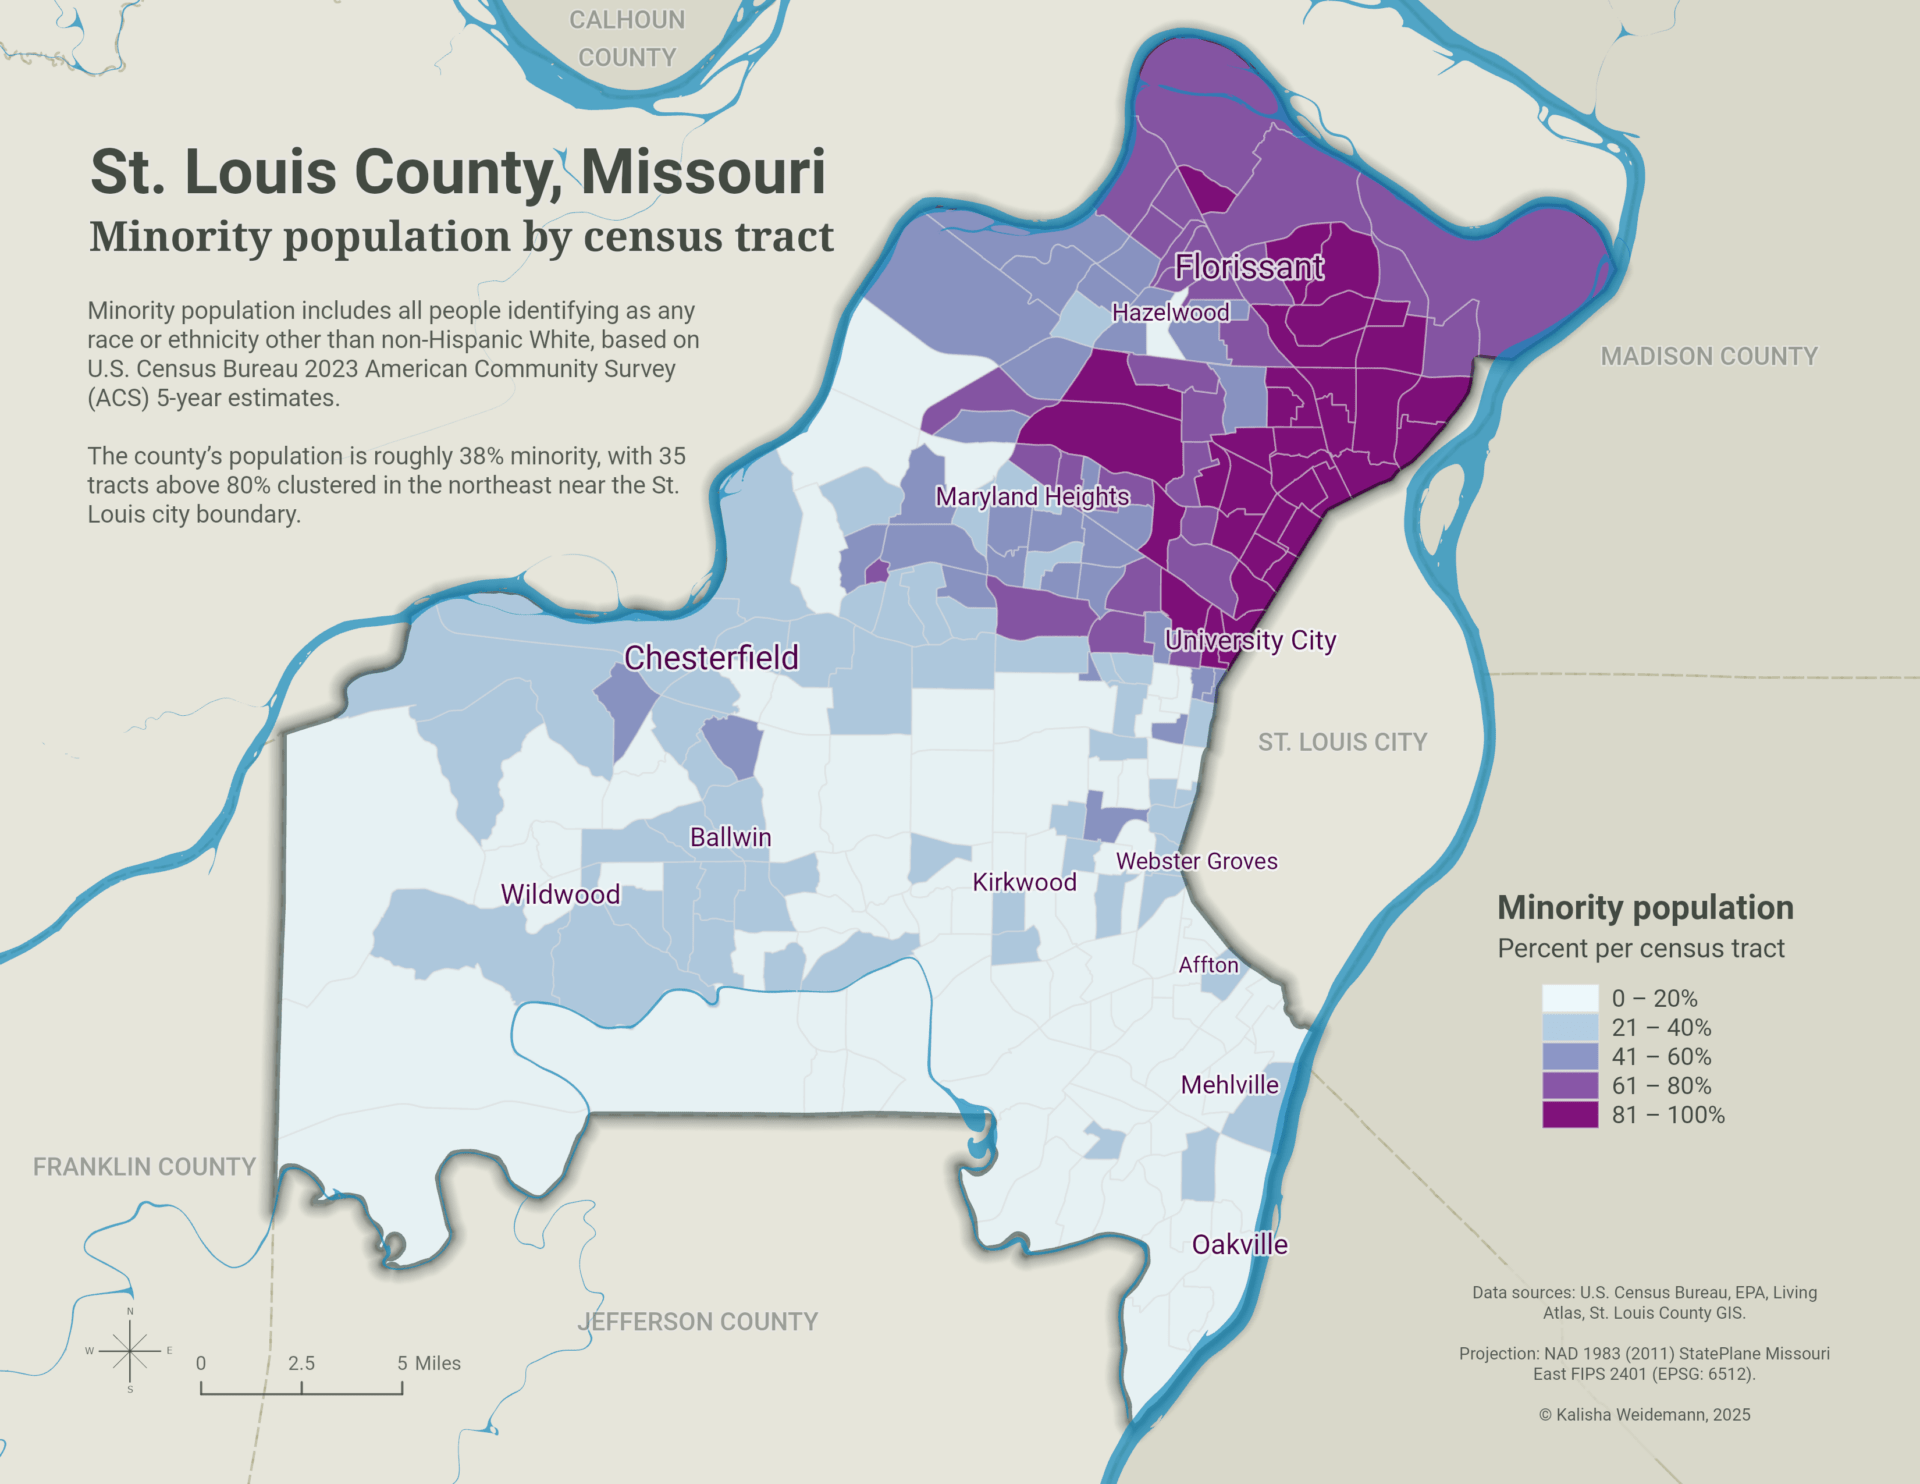
Minority residents make up approximately 38% of the county’s population, but they are not distributed evenly. Thirty-five tracts exceeded 80% minority population, with most concentrated in northeastern St. Louis County. The map shows a pronounced demographic contrast between those northeastern tracts and much of the county to the west and south.
Where the patterns overlap
A bivariate choropleth map combines minority population percentage with total reported air releases by census tract. Each variable was divided into low, medium, and high classes, then represented through a blended color scheme.
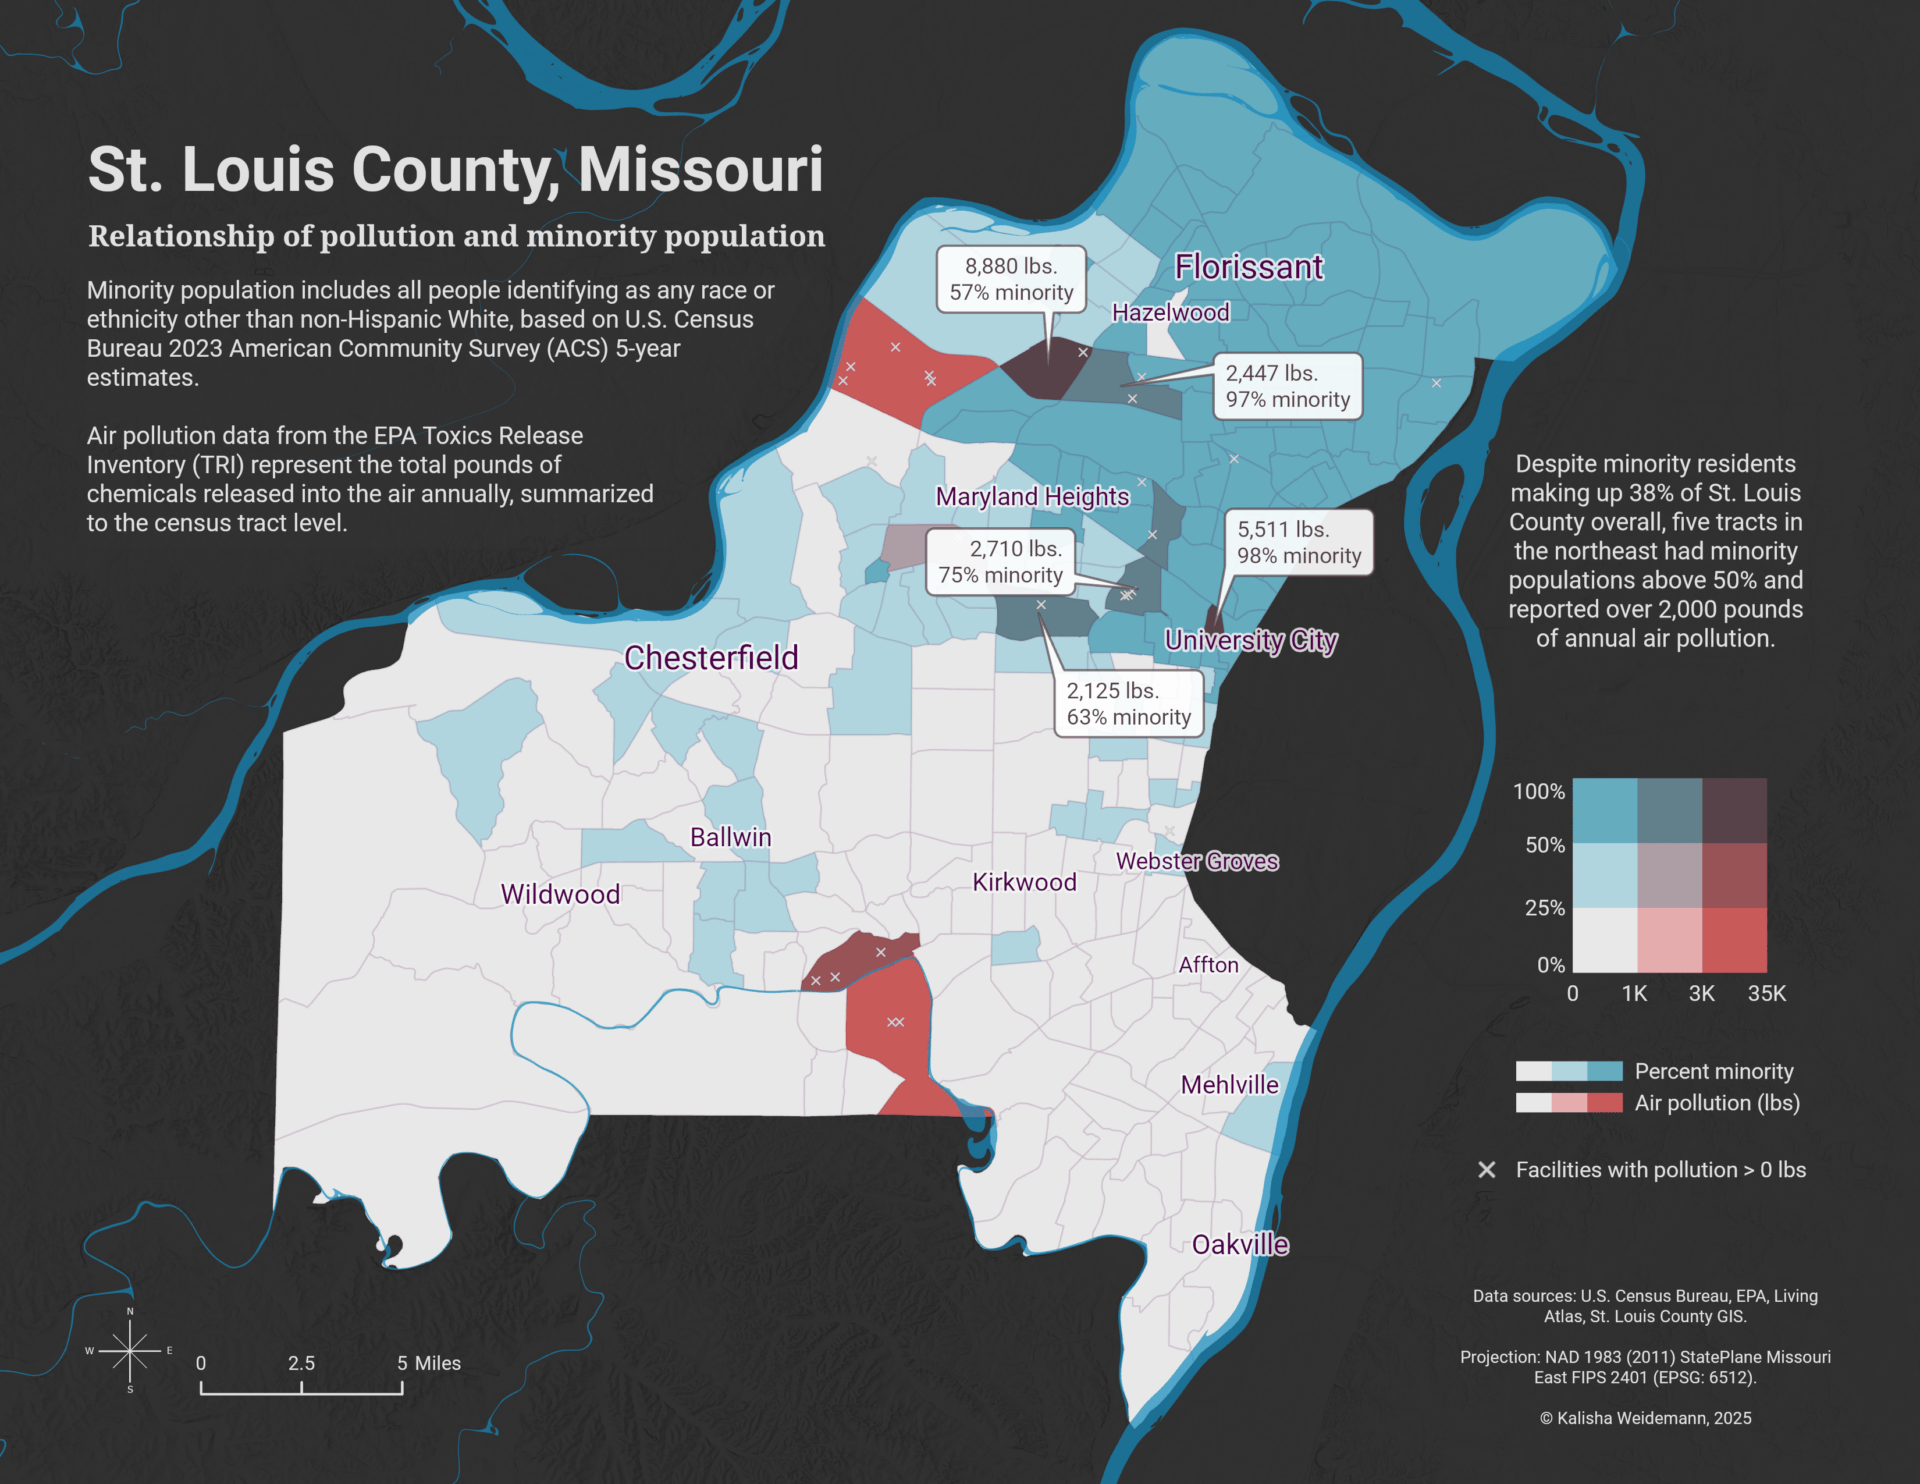
Most tracts had low values for one or both variables. A localized cluster of five northeastern tracts stood out with minority populations above 50% and more than 2,000 pounds of reported annual air releases.
These tracts identify locations where industrial emissions and demographic patterns overlap. They do not, by themselves, establish higher pollution exposure or explain how released chemicals moved beyond the reporting facilities.
Testing the countywide relationship
The bivariate map shows where the two variables overlap. The interactive Tableau dashboard complements it with a scatterplot examining whether tracts with higher minority populations also tended to contain greater reported release volumes.
Selecting a census tract in either view highlights it in the other, allowing individual locations and outliers to be examined in geographic and statistical context.
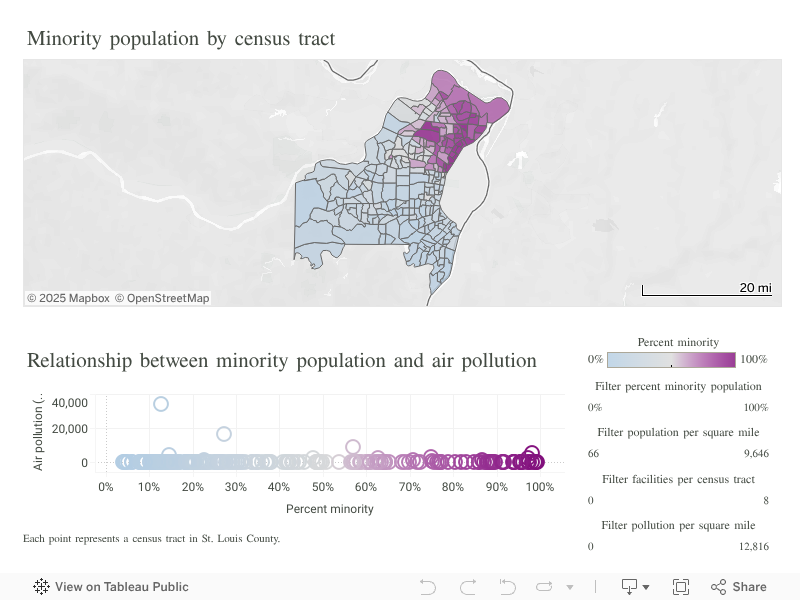
Interactive dashboard linking the tract map and scatterplot. Selecting a tract in either view highlights its location and corresponding values in the other.
The scatterplot indicates a very weak countywide relationship. Minority population percentage alone explains little of the variation in reported releases, which is heavily influenced by a small number of high-volume facilities.
What the maps show
Reported industrial air releases and minority population each have a distinct geography in St. Louis County. Emissions are dominated by relatively few facilities, while tracts with the highest minority populations are concentrated in the northeast. The overall statistical relationship between the variables is weak, although a small group of tracts contains relatively high values for both.
Presenting the variables separately, together, and through a linked dashboard reveals different parts of that story. The univariate maps establish each spatial pattern, the bivariate map identifies local co-occurrence, and the scatterplot tests whether those local overlaps form a broader countywide relationship.
Limitations
- Reporting scope: TRI includes only facilities and chemicals subject to federal reporting requirements. Smaller emitters and sources such as vehicles and residential heating are not represented.
- Chemical differences: Total pounds treat chemicals with different toxicities and health effects as equivalent.
- Emissions versus exposure: Reported releases indicate where emissions originated, not ambient concentrations or individual exposure. Dispersion depends on wind, topography, release height, and other conditions.
- Spatial resolution: Census tracts can conceal finer-scale variation in both demographic patterns and proximity to facilities.
- Temporal alignment: The 2023 TRI releases and 2019–2023 ACS estimates represent different time frames.
- Exploratory scope: The analysis describes co-occurrence and association but does not establish causation.
Future work could incorporate pollutant toxicity, atmospheric dispersion, prevailing winds, health outcomes, and multiple years of emissions data to evaluate potential disparities more directly.
Citations
Esri. (n.d.). ACS Race and Hispanic Origin Variables – Boundaries [Feature layer]. ArcGIS Living Atlas of the World. https://www.arcgis.com/home/item.html?id=23ab8028f1784de4b0810104cd5d1c8f
Esri. (n.d.). USA Census Counties [Feature layer]. ArcGIS Living Atlas of the World. https://www.arcgis.com/home/item.html?id=14c5450526a8430298b2fa74da12c2f4
Esri. (n.d.). USA Census States [Feature layer]. ArcGIS Living Atlas of the World. https://www.arcgis.com/home/item.html?id=774019f31f8549c39b5c72f149bbe74e
Esri. (n.d.). USA Census Urban Areas [Feature layer]. ArcGIS Living Atlas of the World. https://www.arcgis.com/home/item.html?id=10551da8fcd24062b1857473252b3df8
Esri. (n.d.). USA Major Cities [Feature layer]. ArcGIS Living Atlas of the World. https://www.arcgis.com/home/item.html?id=9df5e769bfe8412b8de36a2e618c7672
Esri, & U.S. Geological Survey. (n.d.). National Hydrography Dataset Plus High Resolution [Feature layer]. ArcGIS Living Atlas of the World. https://www.arcgis.com/home/item.html?id=f1f45a3ba37a4f03a5f48d7454e4b654
Nelson, J. (2020, January 29). How to make this paper terrain map of Germany. ArcGIS Blog. https://www.esri.com/arcgis-blog/products/arcgis-pro/mapping/how-to-make-this-paper-terrain-map-of-germany
U.S. Census Bureau. (2024). 2024 TIGER/Line shapefiles: Roads [Data set]. https://www.census.gov/cgi-bin/geo/shapefiles/index.php?year=2024&layergroup=Roads
U.S. Environmental Protection Agency. (2023). TRI Basic Data Files: Calendar Year 2023 [Data set]. https://www.epa.gov/toxics-release-inventory-tri-program/tri-basic-data-files-calendar-years-1987-present
U.S. Geological Survey. (n.d.). USGS 3DEP 10m National Map Seamless [Data set]. Google Earth Engine Data Catalog. https://developers.google.com/earth-engine/datasets/catalog/USGS_3DEP_10m
Categories: Mapping, Spatial analysis