Using attribute queries and spatial joins to explore the relationship between historic sites, recreational trails, and access infrastructure in Boston, Massachusetts.
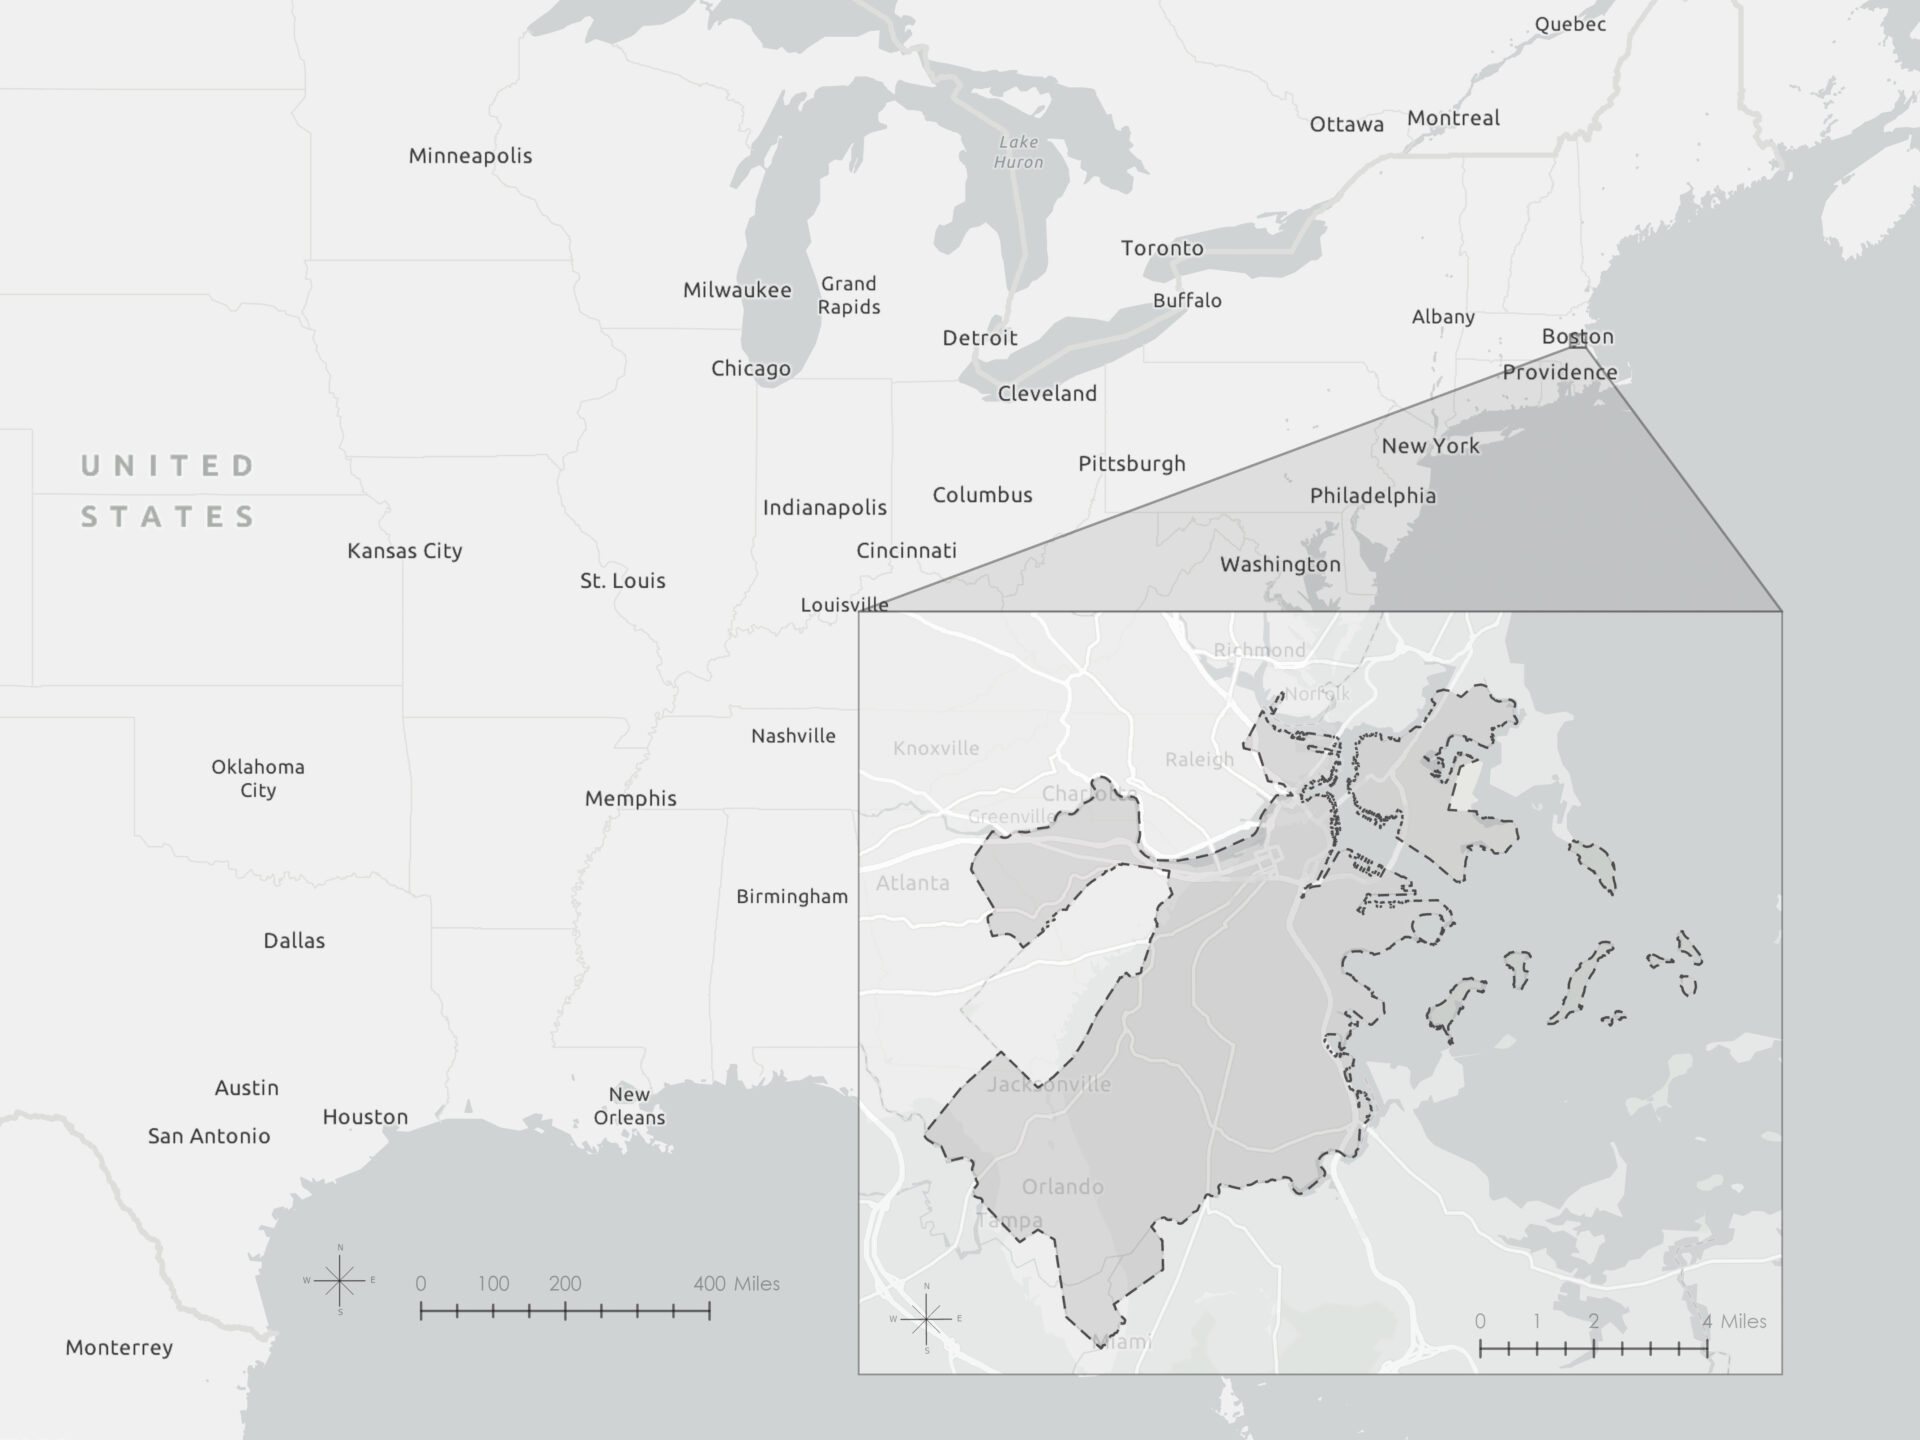
Study area
Data
This analysis drew on publicly available GIS datasets from MassGIS, the City of Boston, and the MBTA.
| Layer | Source | Feature service / dataset |
| Public libraries | Analyze Boston | Public Libraries |
| Historic sites | MassGIS | MassHistoric Commission Inventory |
| Hiking and bicycle trails | MassGIS | Massachusetts Hiking and Wilderness Trails and Bike Trails |
| Rapid transit and bus routes | MassGIS | MBTA Rapid Transit and Bus Routes |
| Boston neighborhoods | Analyze Boston | Boston Neighborhood Boundaries |
| Boston zoning | Analyze Boston | Boston Zoning Subdistricts |
| Boston boundary | MassGIS | Massachusetts Municipalities |
All spatial data were downloaded on July 14, clipped to the Boston municipality area (using query TOWN = ‘BOSTON’ to filter the Massachusetts Municipalities dataset), and projected to NAD 1983 StatePlane Massachusetts Mainland FIPS 2001 (US Feet) prior to analysis. The NAD 1983 StatePlane Massachusetts Mainland projection minimizes distortion for area and distance at the city scale.
Attribute queries
Which historic sites in Boston were considered to have artistic significance?
Using the Select Layer By Attribute tool, I queried the 17K+ records in the Historic sites layer to identify features with artistic significance. I applied a LIKE SQL expression to the Significance field, which contains one or more semicolon-separated values describing the cultural or historical importance of each site.
SIGNIFICAN LIKE '%Art%'The results were exported to a new feature class named Historic art sites.

The query returned 598 historic sites across Boston that are designated as significant for their connection to art or artistic value. These include locations associated with visual art, architecture, design, or institutions dedicated to artistic expression. The selected features are most densely clustered near Downtown and Beacon Hill neighborhoods.
Which bike trails were longer than 1 mile?
Using Select Layer By Attribute on the Bike trails layer, I identified all trails with a length greater than one mile. Since the SHAPE_Length field is stored in feet, I used a threshold of 5,280 feet.
SHAPE_Length > 5280After applying the expression, I exported the selected features into a new feature class called Bike trails over 1 mi.

The query returned 10 bike trails in Boston that exceed one mile in length, with the two longest stretches occurring along Dorchester Bay and through Franklin Park.
Spatial queries
Which historic sites were within 500 feet of a rapid transit stop?
I used Select Layer By Location to identify historic sites located within 500 feet of an MBTA rapid transit stop. The Historic sites layer was used for the input and Rapid transit stops as the selecting layer. I used the Within a distance relationship with a search distance of 500 feet to represent a typical walkable buffer.
Selected features were exported to Historic sites near transit stops.
The query returned 1,764 sites within 500 feet of an MBTA rapid transit stop. The sites cluster most heavily around the Downtown neighborhood, and along the Green and Silver rapid transit lines providing ease of access to many culturally significant destinations.
Which neighborhoods did not have a public library?
To identify neighborhoods without a public library, I used the Select Layer By Location tool. I selected Neighborhoods as the input layer and Public libraries as the selecting features. I applied the Contains relationship and enabled the Invert Spatial Relationship option to return only neighborhoods that do not contain a library.
The result was exported as a new feature class named Neighborhoods with no libraries.
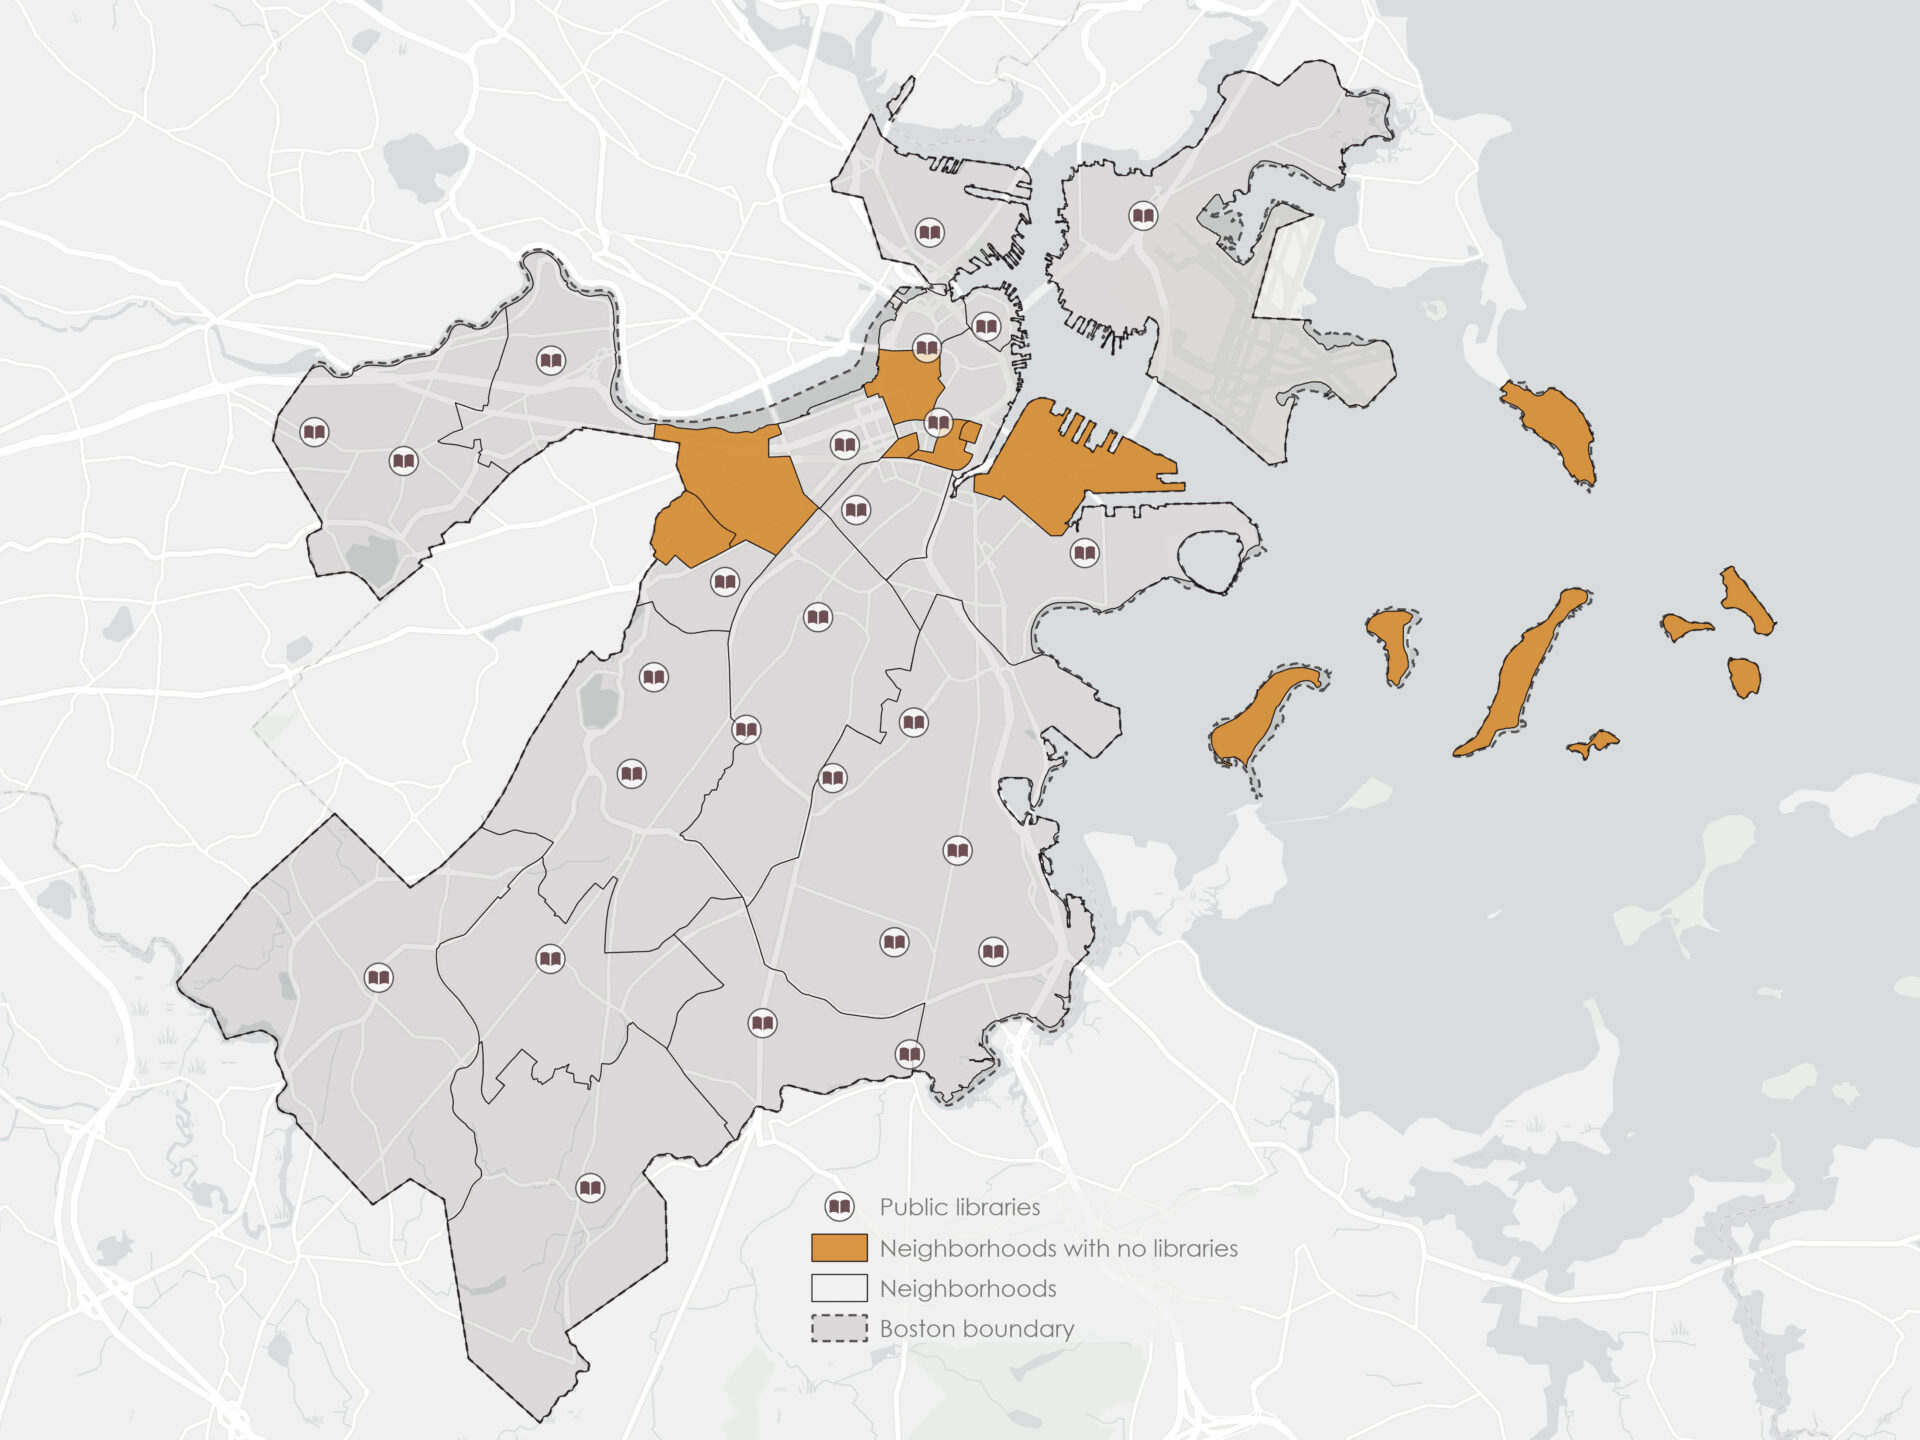
This query returned 8 neighborhoods in Boston that do not contain a public library:
- Longwood
- Bay Village
- Leather District
- Chinatown
- Beacon Hill
- Fenway
- South Boston Waterfront
- Harbor Islands
While it may not make sense for some neighborhoods to have a library branch (such as Harbor Islands), it highlights gaps in direct library access in neighborhoods such as Longwood and Bay Village.
Spatial joins
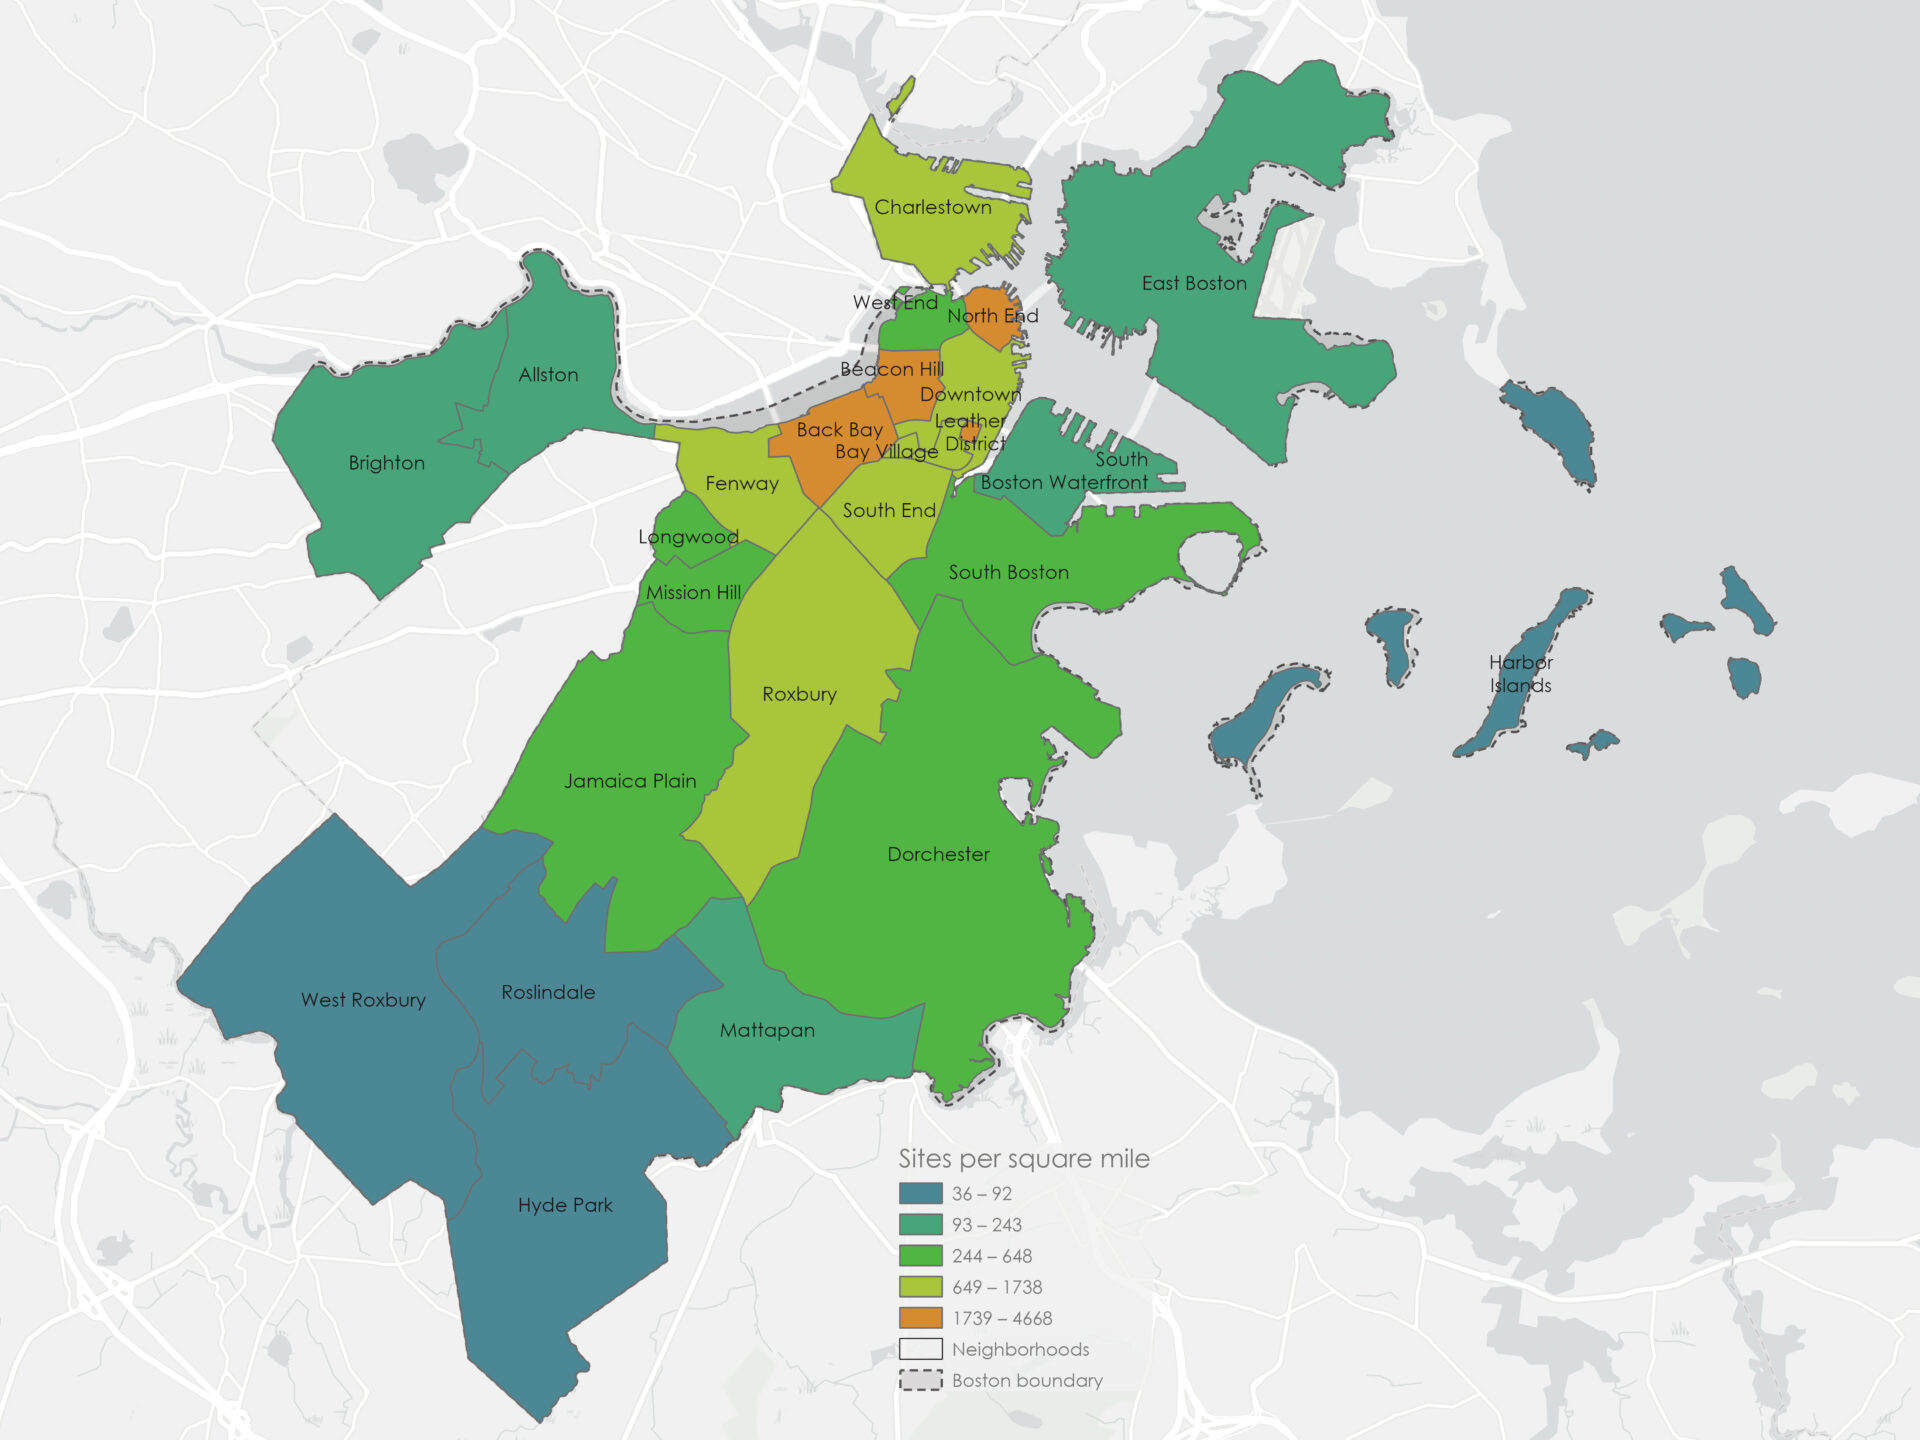
How many historic sites were located within each neighborhood?
To determine how many historic sites were located in each neighborhood, I used the Spatial Join tool, joining the Historic sites point layer to the Neighborhoods polygon layer using the INTERSECTS match option.
This added a Join_Count field to the output layer, indicating the number of historic sites per neighborhood.
| Neighborhood | Total historic sites |
|---|---|
| Roxbury | 2,134 |
| Dorchester | 1,948 |
| Back Bay | 1,748 |
| Beacon Hill | 1,447 |
| Jamaica Plain | 1,192 |
| South End | 1,131 |
| Charlestown | 1,053 |
| South Boston | 854 |
| East Boston | 741 |
| Downtown | 681 |
| Brighton | 634 |
| North End | 621 |
| Fenway | 600 |
| Neighborhood | Total historic sites |
|---|---|
| Hyde Park | 380 |
| Mission Hill | 350 |
| Allston | 347 |
| West Roxbury | 315 |
| Mattapan | 238 |
| South Boston Waterfront | 201 |
| Roslindale | 193 |
| Chinatown | 190 |
| Longwood | 124 |
| West End | 110 |
| Leather District | 49 |
| Harbor Islands | 47 |
| Bay Village | 28 |
While Roxbury contained the highest total number of historic sites, normalizing by neighborhood area revealed that Back Bay, Beacon Hill, North End, and the Leather District had the greatest density of historic sites.
How many bus stops were located in each neighborhood?
I performed a second Spatial Join, this time joining the Bus stops layer to Neighborhoods to calculate the number of bus stops per neighborhood. The match option was set to INTERSECTS to ensure all stops falling within or along neighborhood borders were counted.
The result was a polygon layer with an updated Join_Count field, saved as Bus stops per neighborhood.
| Neighborhood | Total bus stops |
|---|---|
| Roslindale | 132 |
| Jamaica Plain | 93 |
| Mission Hill | 32 |
| Longwood | 18 |
| Bay Village | 3 |
| Leather District | 2 |
| Chinatown | 4 |
| North End | 9 |
| Roxbury | 205 |
| South End | 68 |
| Back Bay | 24 |
| East Boston | 107 |
| Charlestown | 64 |
| Neighborhood | Total bus stops |
|---|---|
| West End | 3 |
| Beacon Hill | 5 |
| Downtown | 45 |
| Fenway | 53 |
| Brighton | 108 |
| West Roxbury | 189 |
| Hyde Park | 168 |
| Mattapan | 67 |
| Dorchester | 367 |
| South Boston Waterfront | 35 |
| South Boston | 127 |
| Allston | 54 |
| Harbor Islands | 0 |
The join identified variation in transit accessibility, with the highest concentration (density based on neighborhood area) around downtown. There didn’t appear to be any bus service on Harbor Islands.

Combination (queries and joins)
Which historic sites of artistic significance were more than 500 feet from a public transportation stop (bus or rapid transit) and located in residential areas?
To identify sites of artistic significance lacking nearby public transit and falling within residential zones, I combined attribute and spatial queries. I repurposed the previously created Historic art sites and used two Select Layer By Location operations with inverted relationships to remove features within 500 feet of bus or rapid transit stops.
This filtered the original list of 598 historic art sites down to 230, which I exported to a new layer (Historic sites > 500ft from transit). Then I used a zoning definition query to isolate residential zoning polygons and selected the historic sites that intersect those zones.
Subdistrict_Use LIKE '%Residential%'The final Select Layer By Location query resulted in 68 historic art sites, the bulk of which were clustered in the Back Bay and Beacon Hill neighborhoods.
The final result included 68 historic sites that were (1) associated with artistic significance, (2) located more than 500 feet from any public transportation stop, and (3) fell within residentially zoned areas.
The most transit-remote site was approximately 1,146 feet (0.2 miles) from the nearest stop, underscoring the overall accessibility of public transportation in Boston — even for historically significant locations situated in residential neighborhoods.
Which neighborhoods contained at least 100 hiking trails and more than 5 rapid transit stops?
I used two sequential Spatial Joins to summarize trail and transit infrastructure within each neighborhood.
First, I joined Hiking trails to Neighborhoods using the INTERSECTS match option to count the number of trails per neighborhood. I exported the result as Hiking trails and transit stops by neighborhood and renamed the output field to Trail_Count. I then joined Rapid transit stops to that result to calculate stop counts per neighborhood, stored in a field called Transit_Count.
Using Select Layer By Attribute, I selected neighborhoods with Trail_Count >= 100 and Transit_Count > 5, and exported the result to Neighborhoods with trails and transit.
The analysis identified four neighborhoods that contained both a high density of hiking and biking trails (≥100) and more than 5 rapid transit stops. These neighborhoods — Fenway, Roxbury, Allston, and Brighton — represent key multimodal zones that support walkability, recreation, and public transit access.
Conclusion
This project explored the spatial relationships between historic sites and access infrastructure in Boston using attribute queries, spatial queries, and spatial joins.
Several limitations should be considered when interpreting these results:
- Some spatial datasets (e.g., historic site inventories or trail networks) may have contained incomplete or uneven coverage due to differing collection dates or agency priorities.
- Proximity-based queries (e.g., within 500 feet of a stop) used Euclidean (straight-line) distance, which does not reflect walkable distance or barriers.
- Analyses of feature counts by neighborhood did not adjust for population or usage density, which would provide additional insight into density calculations.
Software and tools
This analysis was conducted using ArcGIS Pro 3.5.2. The workflow was adapted from query and spatial join tutorials in Mastering ArcGIS Pro.
All spatial data were downloaded in July 2025 and projected to NAD 1983 StatePlane Massachusetts Mainland FIPS 2001 (US Feet) prior to analysis.
Citations
City of Boston. (n.d.). Boston Neighborhood Boundaries [Data set]. Analyze Boston. https://uagis.maps.arcgis.com/home/item.html?id=dba3f84748654013a04d24dcfe3725be
City of Boston. (n.d.). Boston Zoning Subdistricts [Data set]. Analyze Boston. https://uagis.maps.arcgis.com/home/item.html?id=86e2b8d6fcf94ee2832dbb6758ee03d5
City of Boston. (n.d.). Public Libraries [Data set]. Analyze Boston. https://uagis.maps.arcgis.com/home/item.html?id=cb00f9248aa6404ab741071ca3806c0e
Massachusetts Bay Transportation Authority (MBTA). (n.d.). Rapid Transit [Data set]. Boston Maps. https://boston.maps.arcgis.com/home/item.html?id=fffb5de90c814daabf2cfd5538b8d22c
Massachusetts Department of Conservation and Recreation. (n.d.). Massachusetts Hiking and Wilderness Trails [Data set]. MassGIS. https://massgis.maps.arcgis.com/home/item.html?id=c1c31142e2664fc5bc43c50ecb942f27
Massachusetts Historical Commission. (n.d.). MassHistoric Commission Inventory [Data set]. MassGIS. https://uagis.maps.arcgis.com/home/item.html?id=e27a15d822ef4b10bb4dd6eb631ceb3c
MassGIS. (n.d.). Bike Trails [Data set]. https://massgis.maps.arcgis.com/home/item.html?id=f3ced38395ab4d5a8b5e7568c7bf8b5d
MassGIS. (n.d.). Massachusetts Municipalities [Data set]. https://uagis.maps.arcgis.com/home/item.html?id=fefd5fb156d9419e80a3944a62bd64ab
MBTA / City of Boston. (n.d.). Bus Routes [Data set]. Analyze Boston. https://uagis.maps.arcgis.com/home/item.html?id=54538f2f92d04c34957e6c2d460d0e5aPrice, M. H. (2020). Mastering ArcGIS Pro. New York: McGraw-Hill Education.