Fire hydrant spacing looks like a point-to-point problem. In practice, the distance that matters is often the distance along the streets connecting those points.
This case study developed and tested a network-based GIS workflow for evaluating fire hydrant spacing within the Albuquerque Bernalillo County Water Utility Authority (ABCWUA) Established Service Area in central New Mexico.
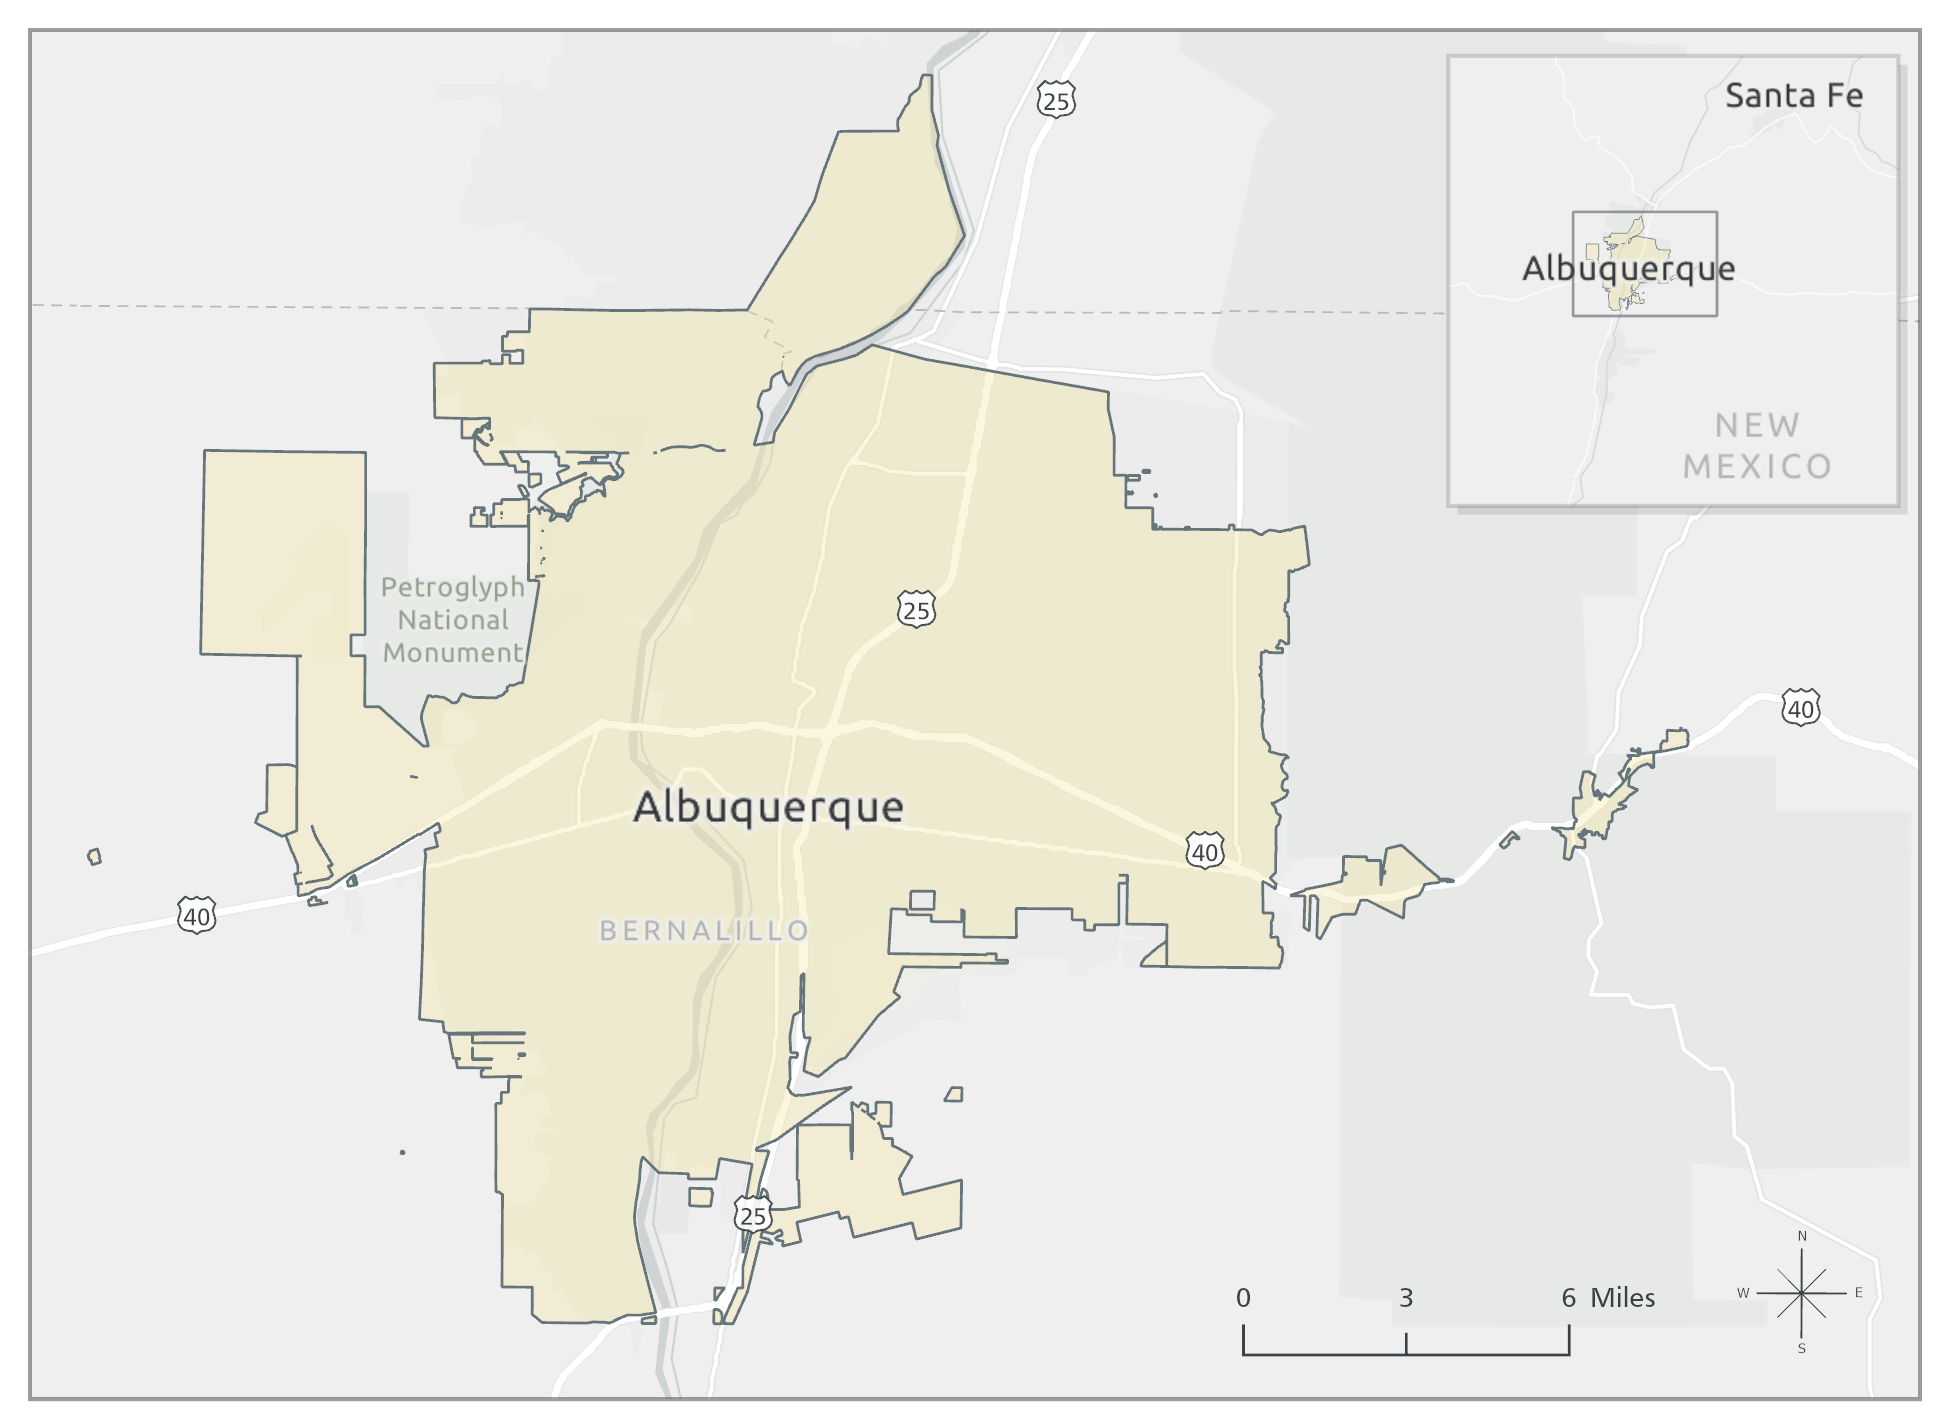
The study area covers approximately 227 square miles and contains 18,914 hydrants.
Rather than measuring straight-line distance, the analysis followed a routable road network to estimate the distance between neighboring hydrants, a measure more closely related to how fire responders and equipment move through the street system.
The initial premise was straightforward: build the network, generate routes, classify spacing distances, and summarize the patterns. The road data complicated that plan. A street can be visible on a map without being connected correctly in a routable network. That distinction ultimately shaped both the workflow and the conclusions.
Data sources
ABCWUA provided the primary hydrant inventory, supplemental hydrant data, and the Established Service Area boundary. Several road datasets were evaluated before selecting a source for the final network, while Fire Boxes and aerial imagery supported local summarization and quality review.
| Dataset | Source | Role in the analysis |
|---|---|---|
| Fire hydrant inventory and supplemental hydrants | Albuquerque Bernalillo County Water Utility Authority | Primary point dataset |
| Established Service Area | Albuquerque Bernalillo County Water Utility Authority | Study-area boundary |
| Fire Boxes | Bernalillo County GIS | Local reporting and focused-review geography |
| E911 Road Centerlines | Bernalillo County GIS | Candidate road network |
| 2025 TIGER/Line roads | U.S. Census Bureau | Candidate road network |
| 2026 National Transportation Dataset | U.S. Geological Survey | Candidate road network |
| New Mexico OpenStreetMap extract | OpenStreetMap contributors / Geofabrik | Road source selected for final routing network |
| NAIP aerial imagery | USDA National Agriculture Imagery Program via New Mexico RGIS | Visual review and on-the-ground context |
| Light Gray Canvas basemap | Esri | Cartographic context for final map figures |
All analytical datasets were projected to NAD 1983 HARN StatePlane New Mexico Central FIPS 3002 (US Feet).
Choosing a road network
The evaluation started with an E911 road centerline dataset from Bernalillo County, which seemed like a logical authoritative source. An initial network built from the E911 centerlines located 16,941 of the 18,914 study-area hydrants within 100 feet of the network, a success rate of 89.56%.
Mapping the unlocated hydrants revealed areas where corresponding local roads were missing or incomplete. One of those areas was then used to compare four candidate road datasets at the same extent and scale:
- E911
- TIGER/Line
- National Transportation Dataset
- OpenStreetMap (OSM)
OSM provided the most continuous local roadway coverage in the comparison area.
The quantitative test supported the visual review: at the same 100-foot search tolerance, the OSM-derived network located 18,665 hydrants (98.68% of the inventory). A subsequent sensitivity test increased the final network-location tolerance to 175 feet, at which point 18,780 hydrants (99.29%) could be located on the OSM network.

That was enough to select OSM as the strongest available road source for the final analysis. It was not enough to establish that every road connection in the resulting network behaved correctly.
Measuring spacing along streets
The selected OSM roads were prepared as a routable geodatabase network in ArcGIS Pro. Vehicular road classes were retained while pedestrian-oriented features such as footways, paths, cycleways, and steps were excluded. The roads were clipped to the study area, converted to singlepart features, and incorporated into a network dataset using distance in feet as the travel cost.
Hydrants were assigned to network locations using the selected 175-foot tolerance. ArcGIS Network Analyst’s Closest Facility solver was then used to generate shortest-path routes between neighboring hydrants along the road network. Self-matches and zero-length routes were removed, leaving one usable non-self nearest-neighbor route for each hydrant where the network supported one.
For screening and comparison, retained routes were grouped into four network-distance categories:
- 500 feet or shorter
- 501–700 feet
- 701–950 feet
- More than 950 feet
The route results were also summarized by Bernalillo County Fire Box. Route lines were converted to representative points, spatially joined to the Fire Boxes, and summarized to identify local patterns and candidates for closer review. Fire Boxes served as organizational units only (not as regulatory or compliance zones).

What the routes showed
The final workflow retained 15,136 usable nearest-neighbor routes.
- 50.1% were 500 feet or shorter
- 23.5% fell between 501 and 700 feet
- 14.7% fell between 701 and 950 feet
- 11.7% were longer than 950 feet
At the full service-area scale, the route coverage looked fairly complete. The map shows where the four distance categories occurred across the ESA and highlights areas where longer network-derived routes were more common.
At this scale, though, it cannot distinguish plausible longer spacing from routes influenced by problems in the road network.
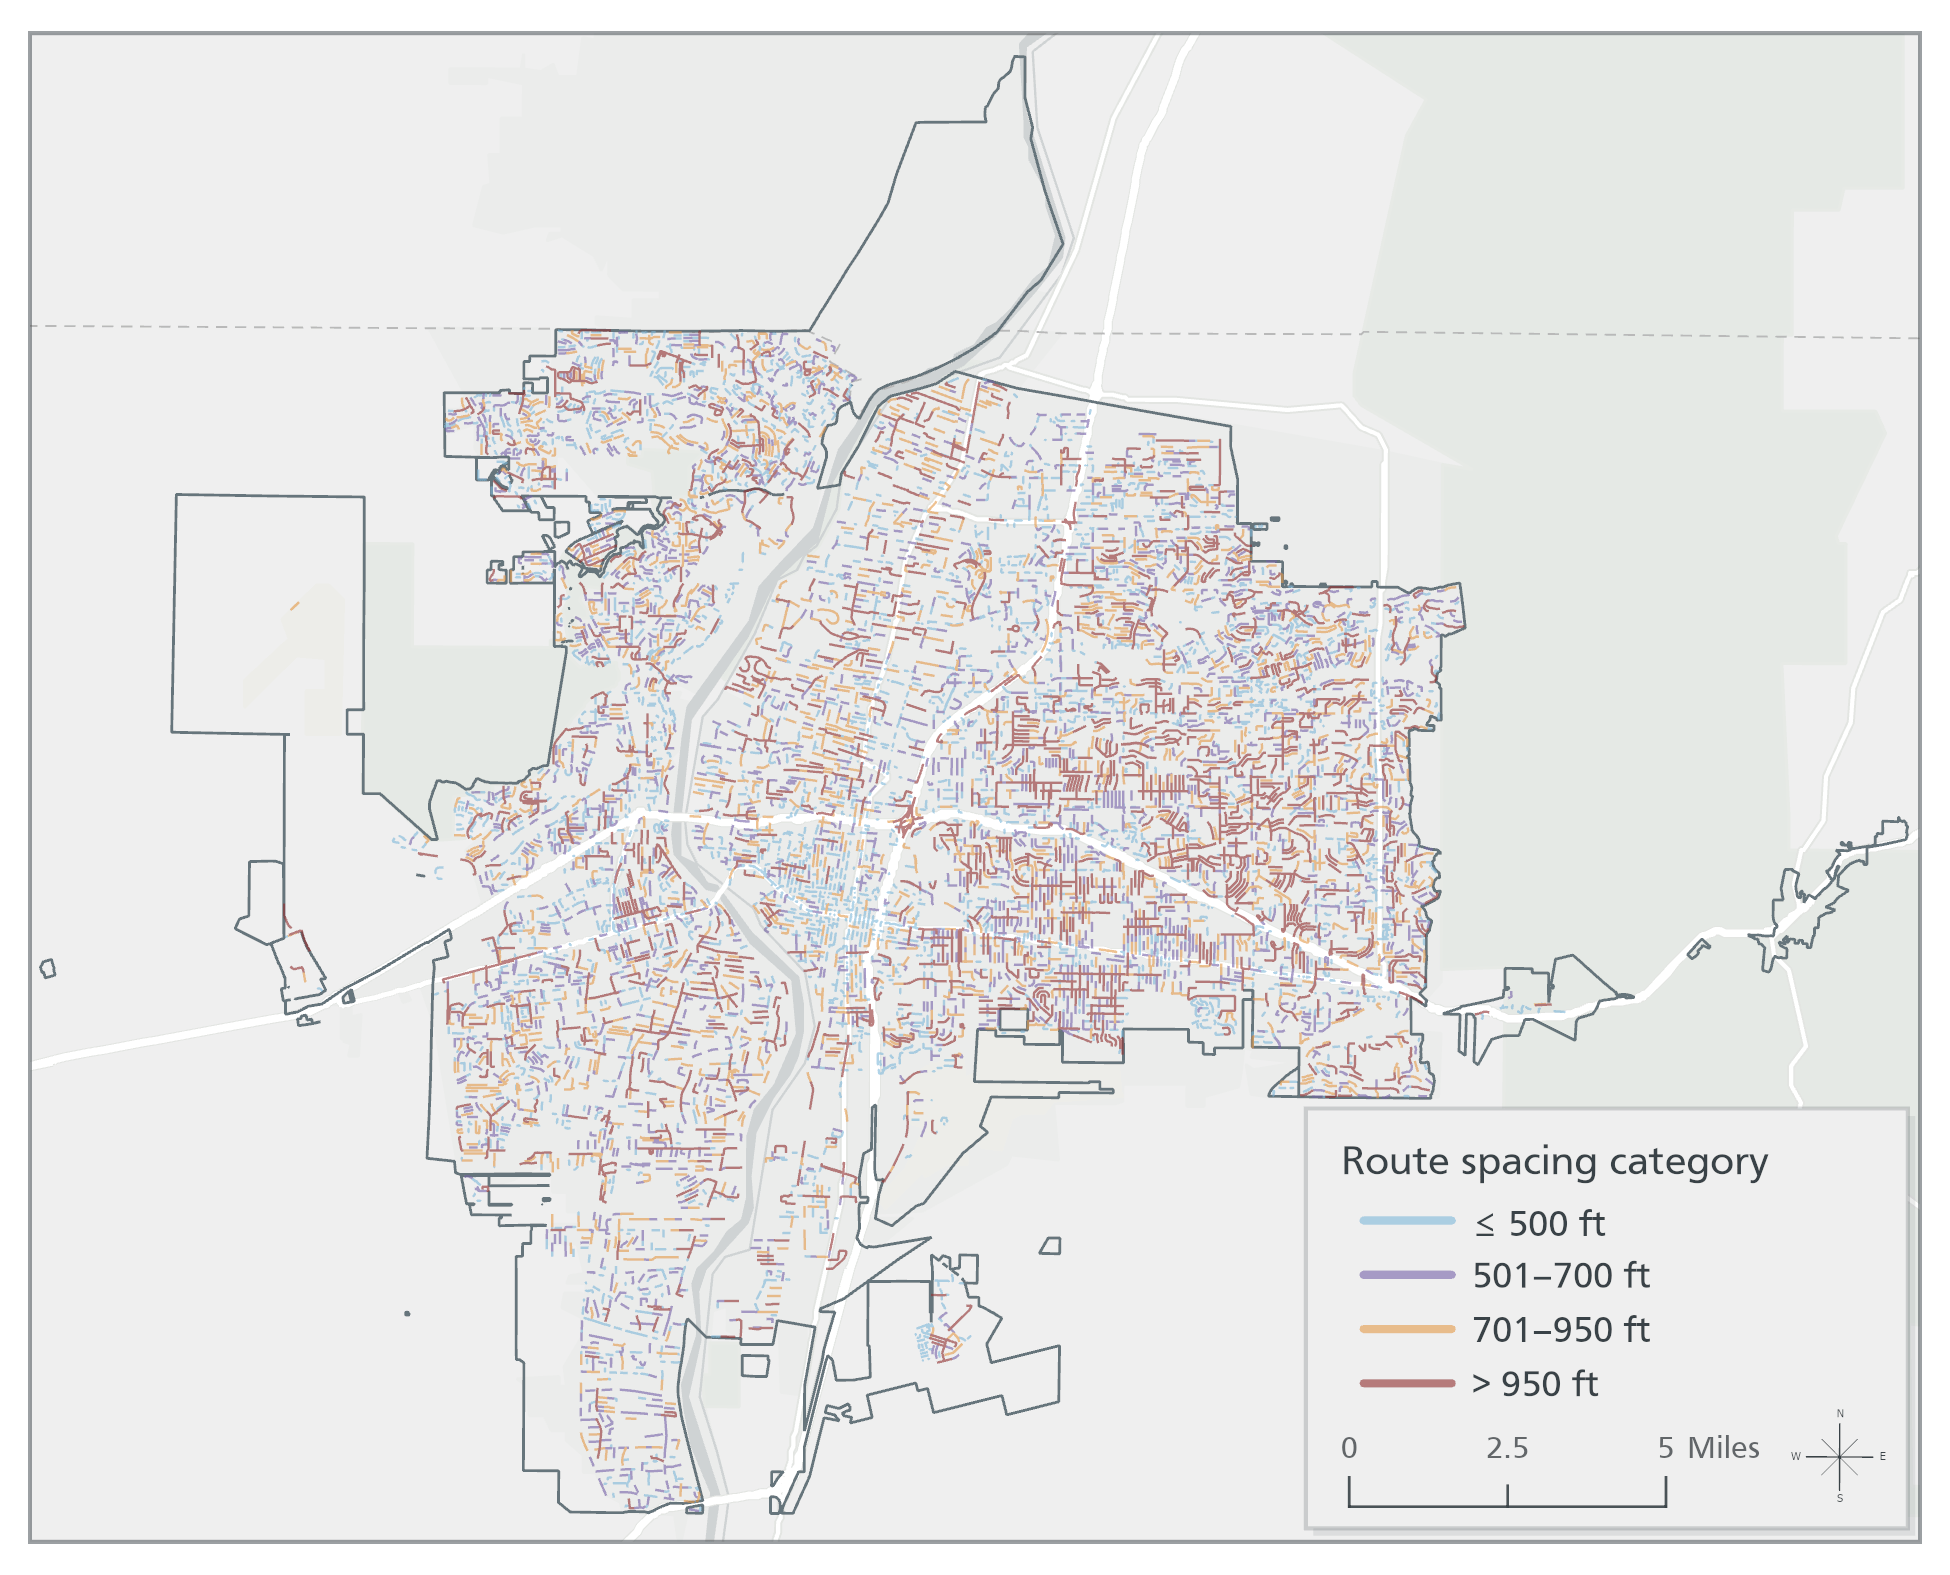
Those results looked tidy at the full service-area scale. The underlying routing was less tidy.
Of the 18,780 hydrants successfully located on the OSM-derived network, 3,640 did not produce a usable neighboring-hydrant route.
Zoomed-in review raised another concern: some routes that did complete appeared to bypass visibly closer hydrants or follow unexpectedly indirect paths. A long route could represent genuinely long network spacing, but it could also reflect a disconnected street segment, a missing network connection, or a nearby hydrant that the solver could not reach through the network as constructed.

That distinction changed how the route results could be interpreted. Rather than treating longer routes as confirmed spacing deficiencies, the output was used as a screening tool to identify patterns and locations for further review. The next step was to look more closely at contrasting Fire Boxes and ask a more useful question: did the routes actually make sense on the map?
Review of Fire Boxes with different route patterns
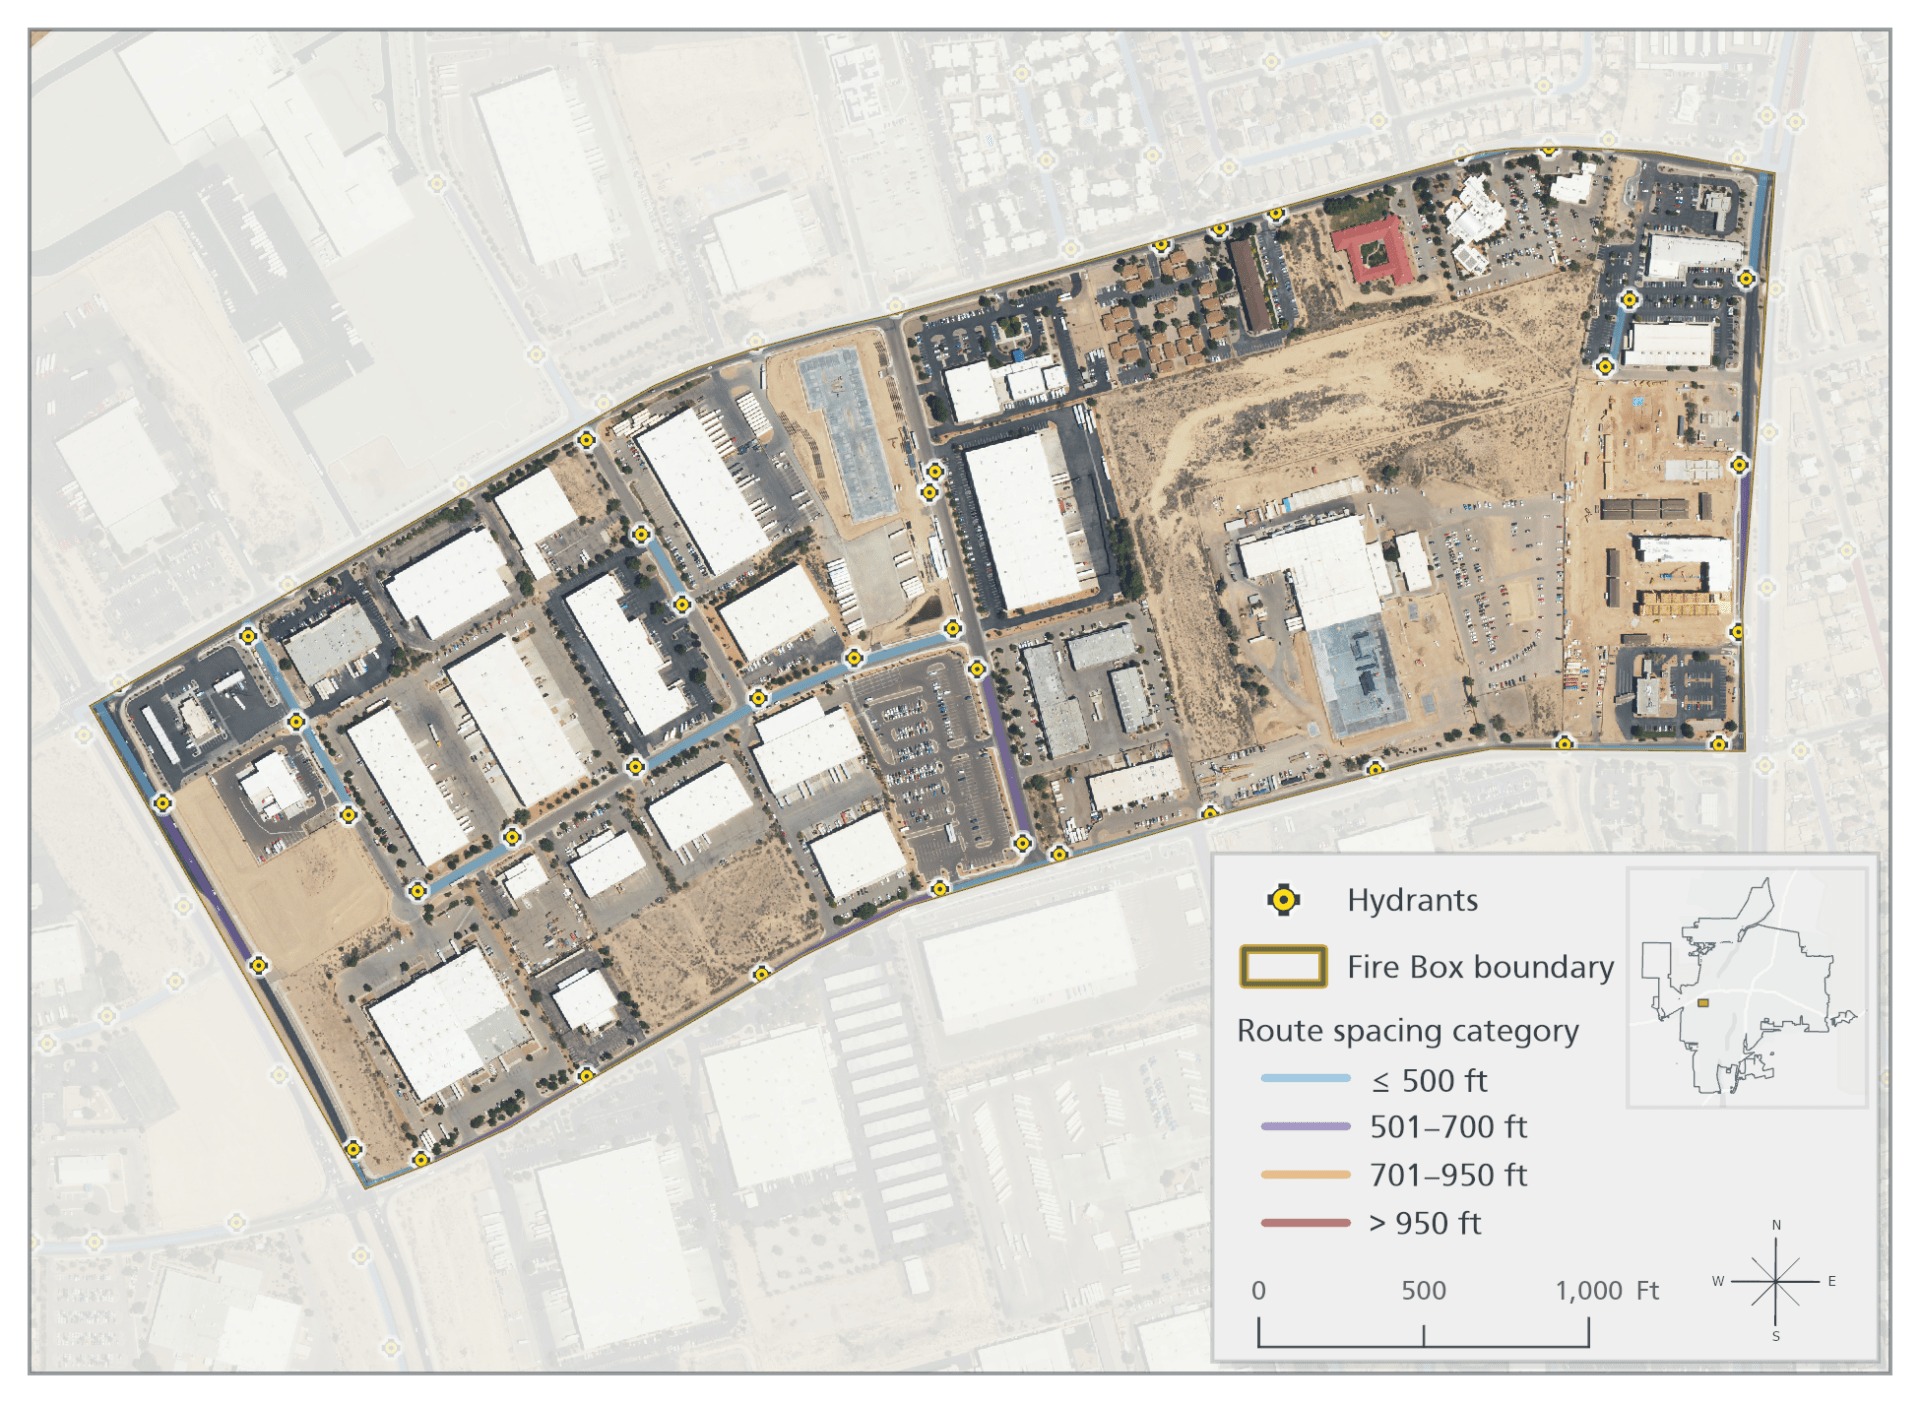
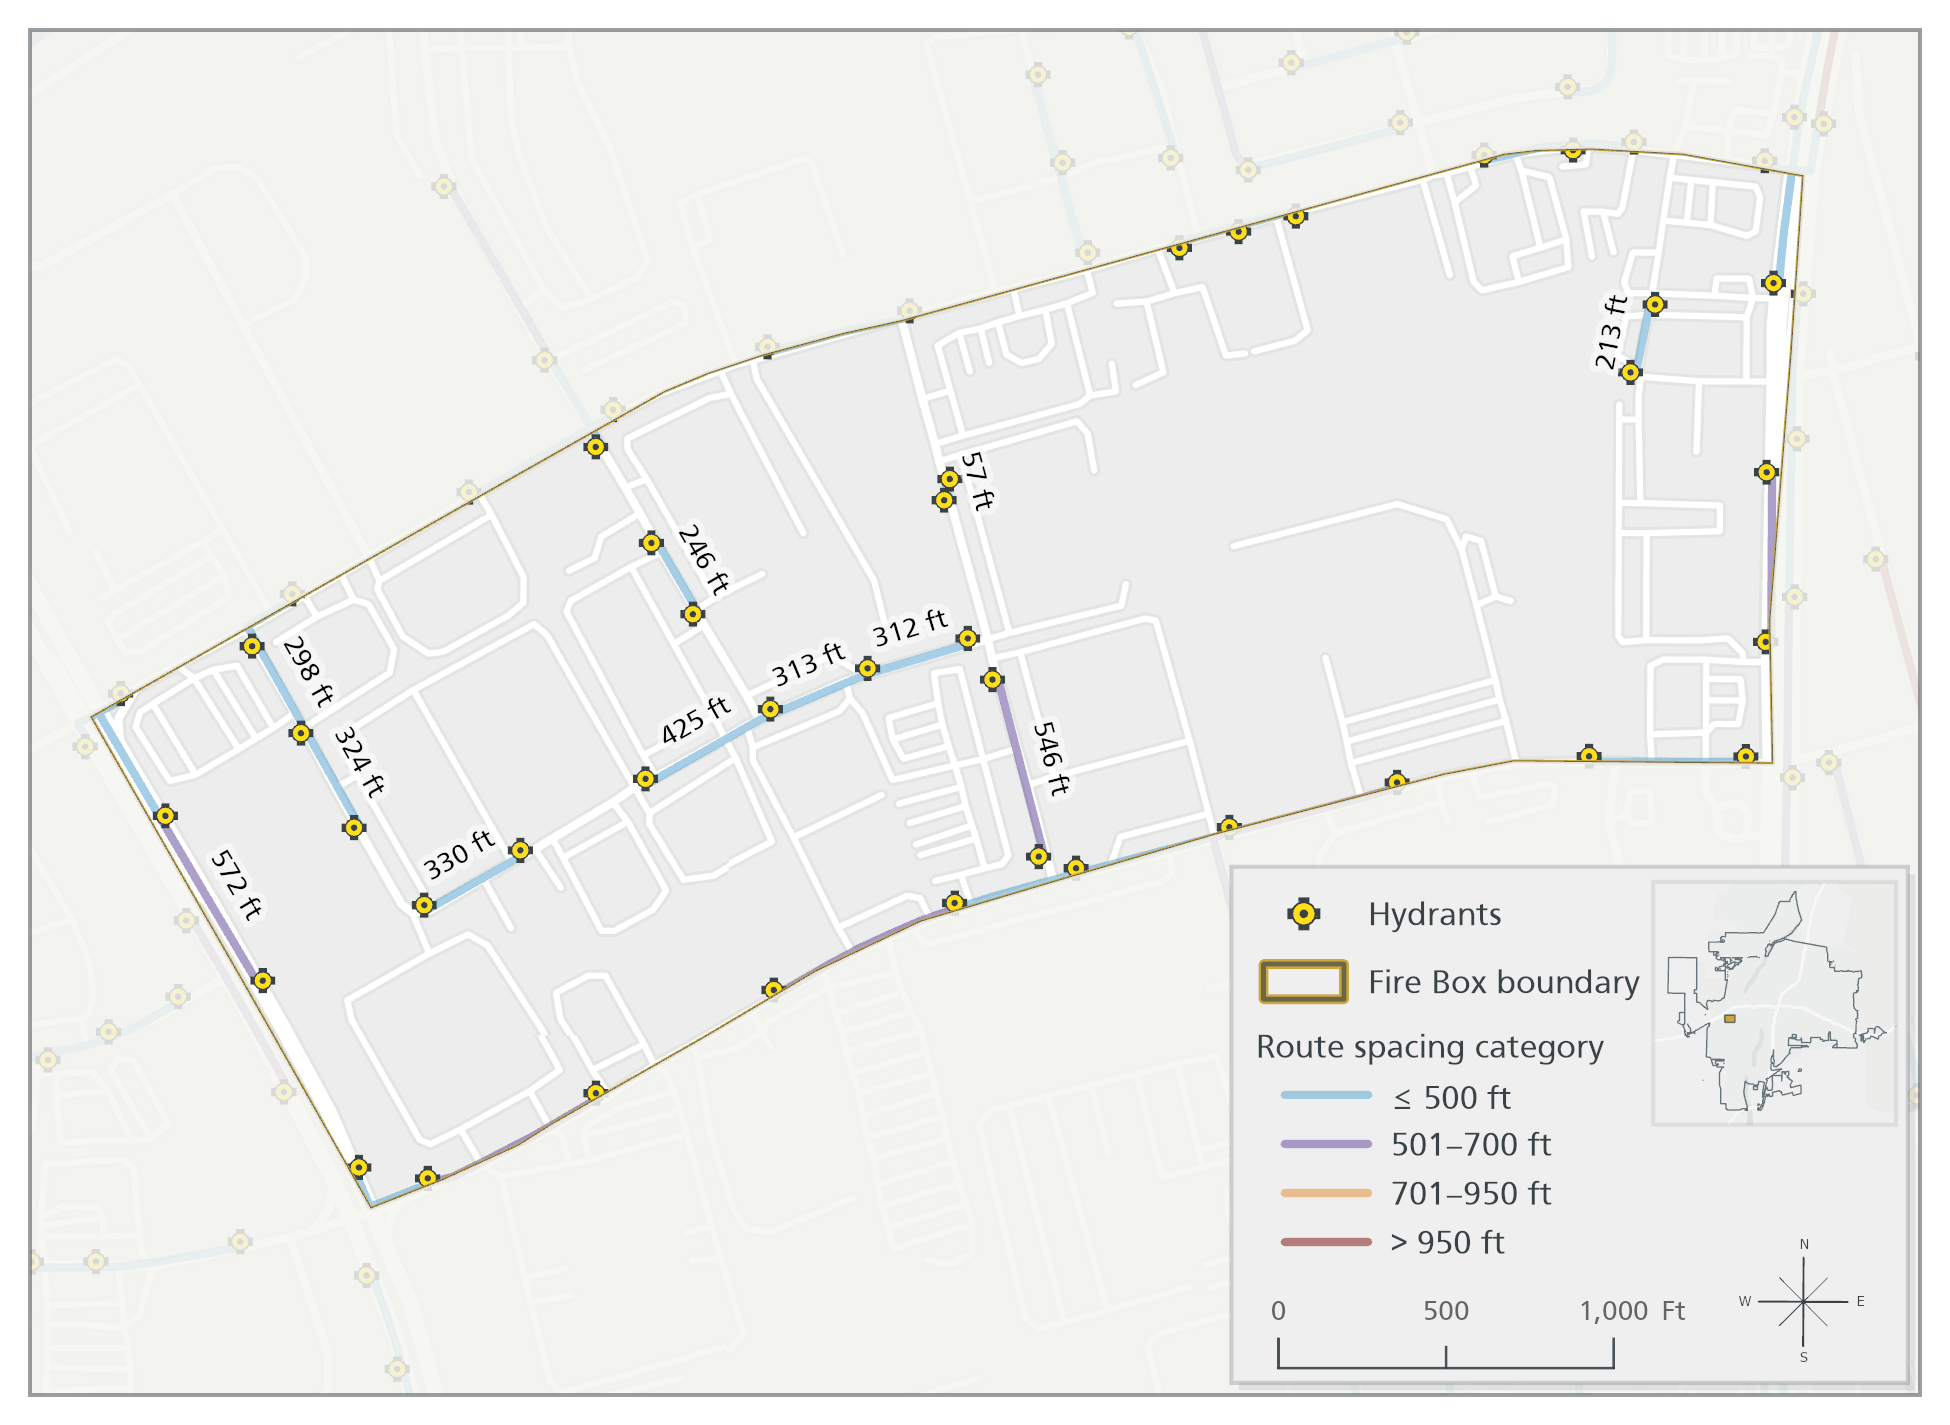
Two Fire Boxes with contrasting route patterns were selected for focused review against hydrant locations, road geometry, and aerial imagery. The comparison helped separate routes that appeared plausible from results that deserved considerably more skepticism.
Higher-confidence Fire Box
In Fire Box 075805, the neighbor matching looks reasonable. The routes generally connect hydrants that are visibly adjacent, and for the most part, the selected paths follow the streets in expected ways. The hydrant locations, road centerlines, and routes agree well enough that the resulting network-distance measurements are visually convincing.
That is what “higher confidence” means here: confidence in the neighbor matching and routing. It does not mean that hydrant spacing was field verified or that the map establishes fire-protection adequacy. Rather, the mapped evidence provides good reason to trust that the routes represent plausible relationships between neighboring hydrants.
Lower-confidence Fire Box
Fire Box 097462 told a very different story. Several routes appeared to bypass nearby hydrants or take unexpectedly long paths through streets that, in the aerial imagery, looked like they should be connected. The routes completed successfully, but the visual evidence raised questions about whether the road network was representing all of the connections on the ground.
That is what “lower confidence” means here. It does not necessarily mean that the longer routes are wrong, but there is less reason to interpret them as straightforward measures of hydrant spacing. Missing connections or disconnected network components may have limited which hydrants the solver could reach, meaning that even a completed route could still warrant closer review.


Taken together, the two Fire Boxes made one of the most useful findings of the case study clear. Successfully locating hydrants on the network and generating routes were necessary steps, but neither guaranteed a convincing nearest-neighbor relationship. The solver could return a completed route even when the selected neighbor or path did not make sense on the map.
What the case study demonstrated
The analysis produced a repeatable network-analysis workflow, a service-area-wide screening dataset, and a useful framework for identifying questionable routes. It did not produce a fully validated assessment of actual hydrant spacing conditions across the ESA. The road network was not simply a supporting dataset. It controlled the analysis.
If the workflow were repeated, the stronger approach would be to begin with a smaller study area and put more effort into validating the road network before scaling up. That would include reviewing roads against high-resolution imagery, correcting missing or disconnected segments, checking topology and network components, and rebuilding and testing the network after corrections. With a well-validated local network in place, alternative methods for identifying neighboring hydrants could also be compared before extending the workflow across a larger area.
That is a less tidy result than a single map of “good” and “bad” hydrant spacing, but it is a more defensible one. Network analysis can produce precise-looking routes long before the underlying network is ready to support that precision.
Start smaller. Validate the network. Then scale.
Citations
Albuquerque Bernalillo County Water Utility Authority. (2026, June 2). Fire hydrant inventory: WATER_HYDRANT and supplemental hydrant additions [Unpublished point data set provided to author].
Albuquerque Bernalillo County Water Utility Authority. (2026, June 8). ABCWUA Established Service Area [Unpublished polygon data set provided to author].
Baik, J., & Murray, A. T. (2024). Emergency response planning: A framework to assess hydrant–structure access. Transactions in GIS, 28, 2412–2424. https://doi.org/10.1111/tgis.13243
Baik, J., & Murray, A. T. (2025). Maximum unobstructed shortest path between multipart-continuous geometries: Enabling novel type of access evaluations for urban safety. Computers, Environment and Urban Systems, 121, Article 102308. https://doi.org/10.1016/j.compenvurbsys.2025.102308
Bernalillo County GIS. (n.d.). E911 Road Centerlines [Feature layer]. ArcGIS REST Services Directory. Retrieved June 3, 2026, from https://pdsgismaps.bernco.gov/server/rest/services/BERNCOCAD/E911_Road_Centerlines/MapServer/249
Bernalillo County GIS. (n.d.). Fire Boxes (Fire) [Feature layer]. ArcGIS REST Services Directory. Retrieved June 3, 2026, from https://pdsgismaps.bernco.gov/server/rest/services/BERNCOCAD/Fire_Boxes__Fire_/MapServer/149
Esri. (n.d.). Basemaps. ArcGIS Pro documentation. Retrieved June 3, 2026, from https://doc.esri.com/en/arcgis-pro/latest/help/mapping/map-authoring/author-a-basemap.html
Esri. (2020). Streamlining hydrant inspections and maintenance with ArcGIS and Maximo. https://www.esri.com/en-us/landing-page/industry/water/2020/abcwua-case-study
Figueroa, V. E., Murray, A. T., & Funk, T. (2024). Supporting fire response: Advanced spatial data analytics for hydrant access assessment. Transactions in GIS, 28, 2559–2573. https://doi.org/10.1111/tgis.13255
Geofabrik GmbH, & OpenStreetMap contributors. (n.d.). Download OpenStreetMap data for New Mexico [Data extract]. Geofabrik Downloads. Retrieved June 18, 2026, from https://download.geofabrik.de/north-america/us/new-mexico.html
Kaufman, M. M., & Rosencrants, T. (2015). GIS method for characterizing fire flow capacity. Fire Safety Journal, 72, 25–32. https://doi.org/10.1016/j.firesaf.2015.02.001
Smith, M., Weingart, E., & Kim, J. (2025, January 24). Wildfires are revealing the limits of our hydrant systems. The New York Times. https://www.nytimes.com/interactive/2025/01/24/us/la-fires-hydrants-water.html
U.S. Census Bureau. (2025). 2025 TIGER/Line shapefiles: Roads [Shapefile]. Retrieved June 3, 2026, from https://www.census.gov/cgi-bin/geo/shapefiles/index.php?year=2025&layergroup=Roads
U.S. Department of Agriculture, Farm Production and Conservation Business Center, Geospatial Enterprise Operations. (2024). Bernalillo County, 2024 NAIP NC ortho mosaic [Aerial imagery]. New Mexico Resource Geographic Information System. https://rgis.unm.edu/rgis6/dataset.html?uuid=4bb54c2a-65c1-4632-92d5-8581b13d3cb0
U.S. Geological Survey, National Geospatial Technical Operations Center. (2026). USGS National Transportation Dataset (NTD) for New Mexico (published 20260212) FileGDB [Data set]. ScienceBase. Retrieved June 18, 2026, from https://www.sciencebase.gov/catalog/item/5a61c956e4b06e28e9c3be6f
Wielebski, Ł., & Medyńska-Gulij, B. (2013). Cartographic visualization of fire hydrants accessibility for the purpose of decision making. Geodesy and Cartography, 62(2), 183–198. https://doi.org/10.2478/geocart-2013-0011
Categories: Mapping, Spatial data management, Spatial analysis