Exploring the spatial relationship between minority population and air pollution exposure at the census tract level in St. Louis County, Missouri.
Study area
St. Louis County is located in eastern Missouri, to the west of St. Louis City. The county is bounded by the Missouri River to the north and the Mississippi river to the east, which divides Missouri and Illinois.
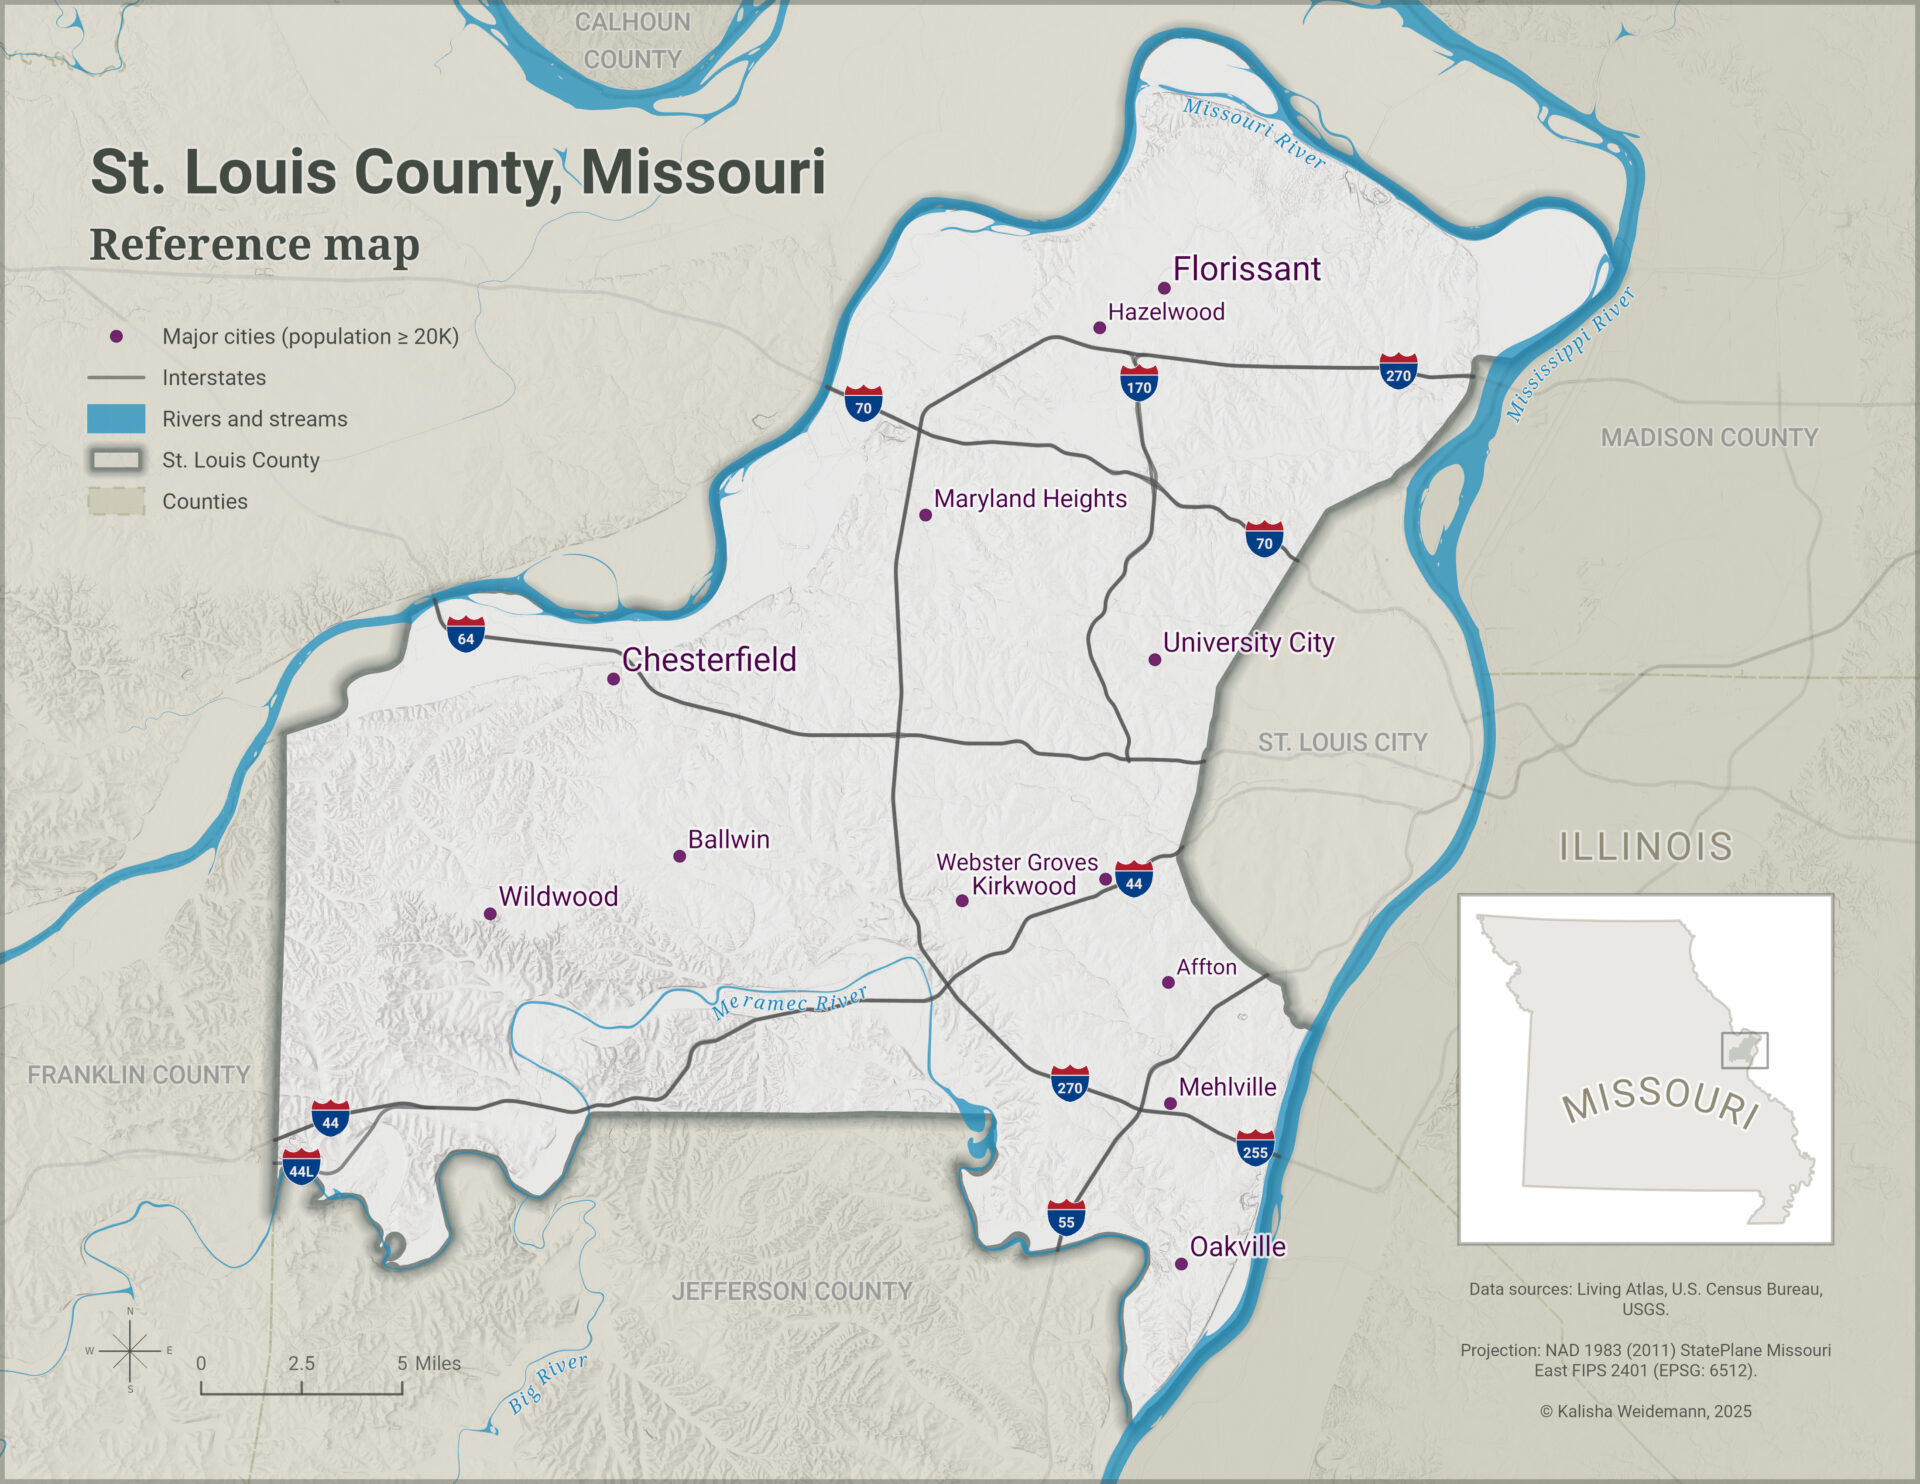
St. Louis County is Missouri’s most populous county, home to more than one million residents (about 16% percent of the state’s population). The county’s geography ranges from the Mississippi River floodplain to the rolling foothills of the Ozark Mountains in the southwest.
Data sources
| Layer | Source | Dataset / service |
|---|---|---|
| Toxics Release Inventory (TRI) | EPA | TRI Basic Data Files: Calendar Years 1987-Present |
| Roads | U.S. Census Bureau | TIGER/Line Shapefiles |
| Rivers and streams | Esri | National Hydrography Dataset Plus High Resolution |
| Major cities | Esri | USA Major Cities |
| Urban areas | Esri | USA Census Urban Areas |
| Census tracts | Esri | ACS Race and Hispanic Origin Variables – Boundaries |
| Counties | Esri | USA Census Counties |
| States | Esri | USA Census States |
| Hillshade | USGS | USGS 3DEP 10m National Map Seamless |
All spatial data were downloaded in September 2025 and clipped to St. Louis County, and projected to NAD 1983 (2011) StatePlane Missouri East FIPS 2401 (Meters) (EPSG: 6512), which provided high spatial accuracy for county-scale analysis.
All analyses were conducted at the census tract level to ensure consistency in spatial scale and data availability.
Volume of air pollution
The following graduated symbol map visualizes air emissions reported by facilities participating in the EPA Toxics Release Inventory (TRI).
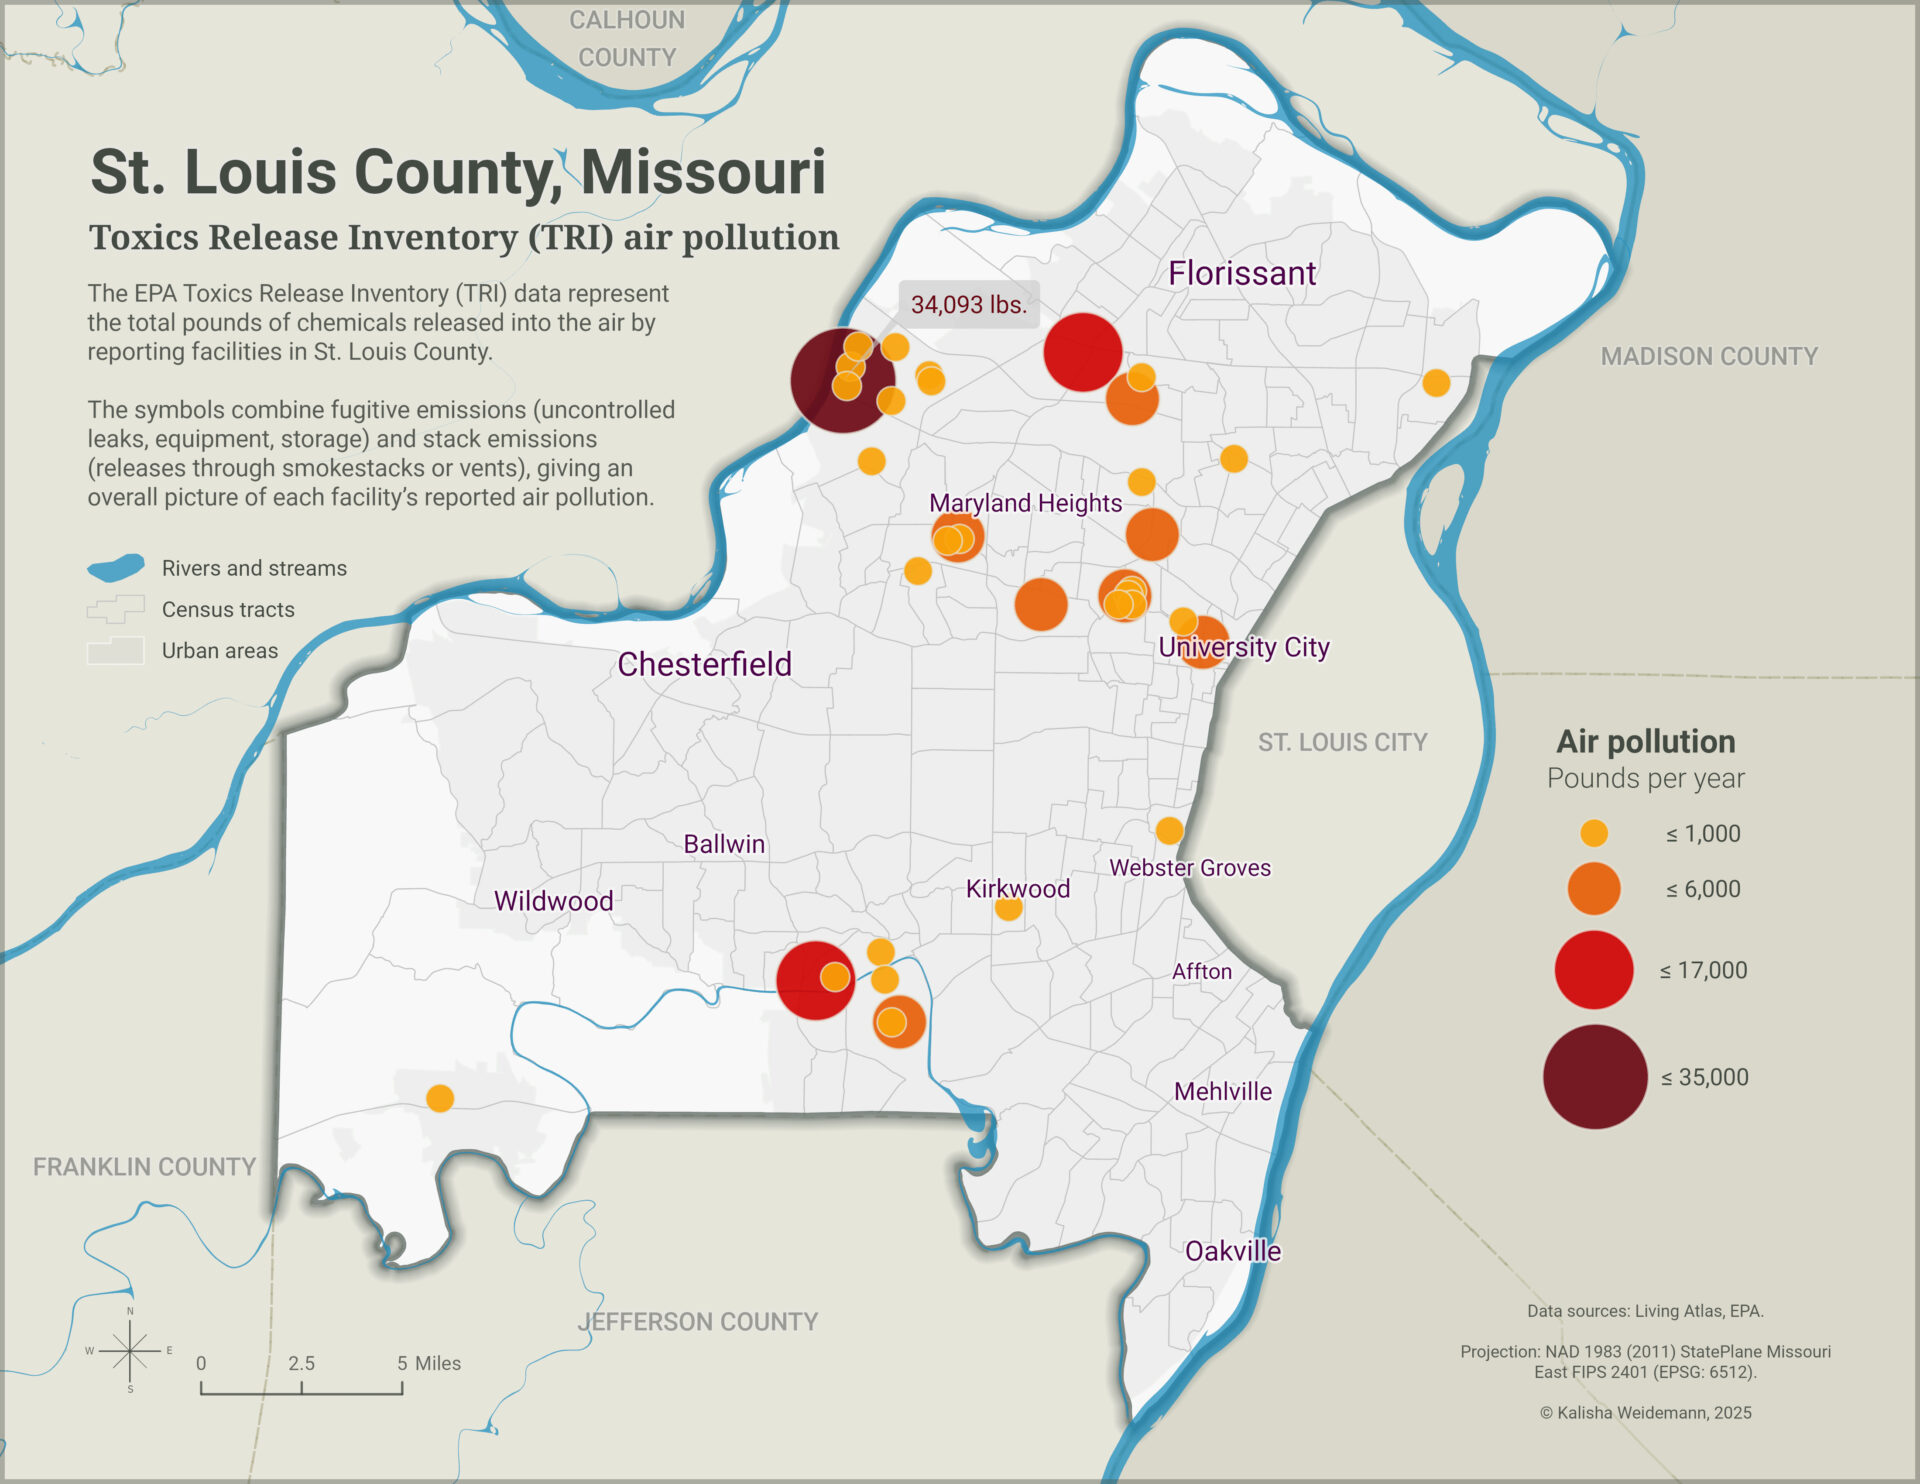
Each symbol represents a facility’s total annual air releases in pounds, combining both fugitive emissions (leaks, equipment, and storage losses) and stack emissions (through smokestacks or vents). The larger, darker symbols indicate higher release volumes.
The map highlights that a few large industrial sites dominate the county’s total emissions, while most tracts report little or no pollution.
Minority population distribution
Demographic data from the U.S. Census Bureau’s 2019–2023 American Community Survey show the percentage of residents identifying as any race or ethnicity other than non-Hispanic White.
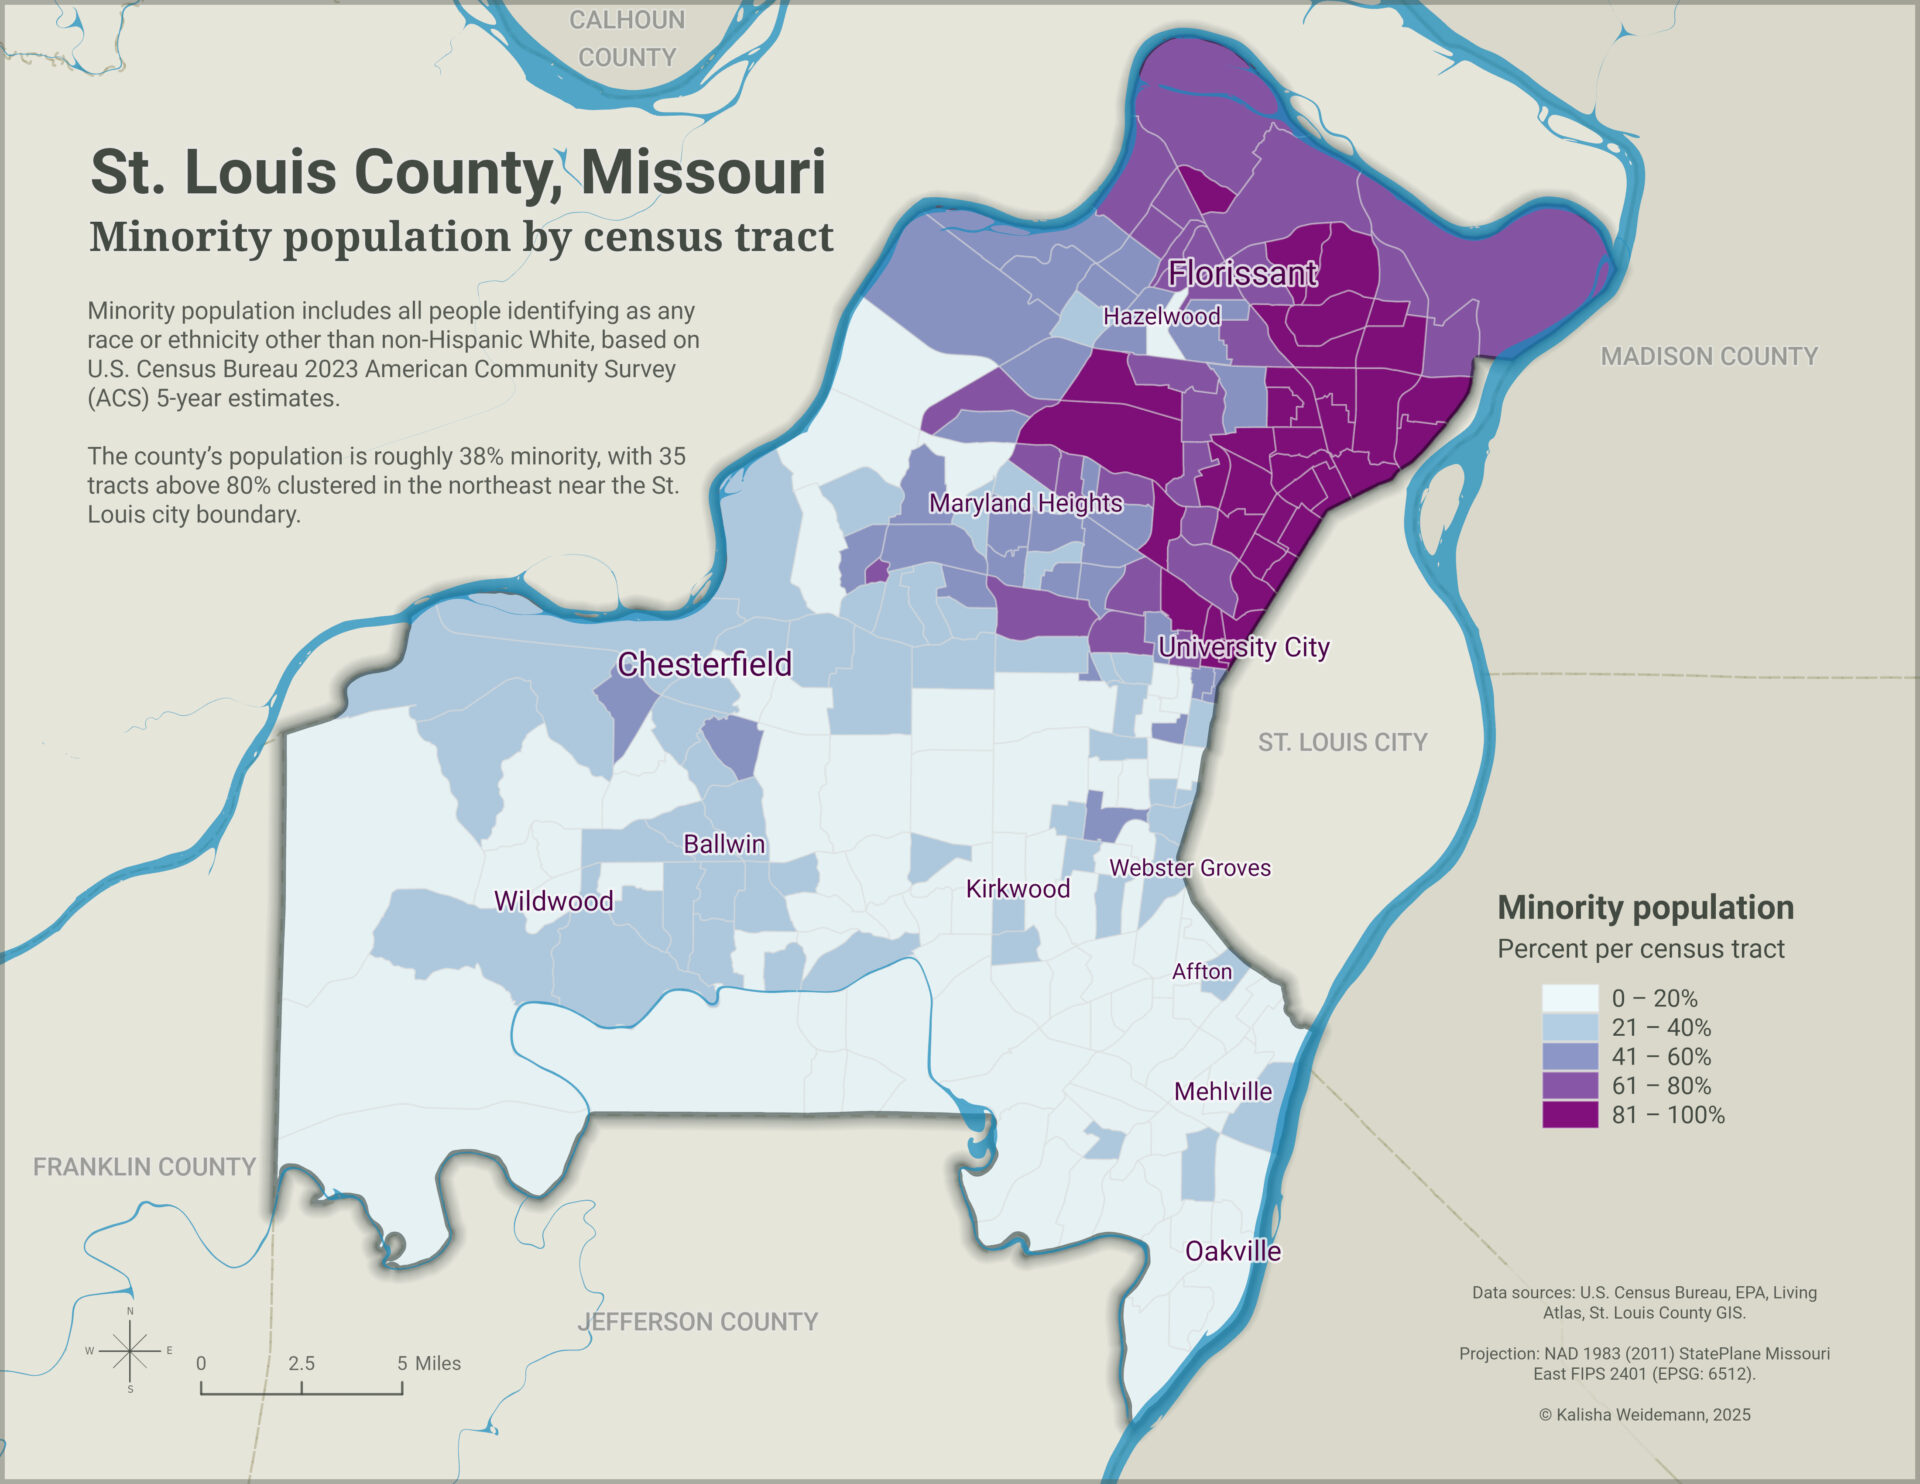
Countywide, minority residents make up roughly 38% of the population. However, the map reveals sharp spatial contrasts: 35 tracts (mostly clustered in the northeast) exceed 80% minority population, underscoring the region’s historical patterns of racial segregation and demographic concentration.
Co-occurrence of air pollution and minority population
To examine possible environmental equity patterns, this bivariate choropleth map combines percent minority population with total annual air pollution per tract.
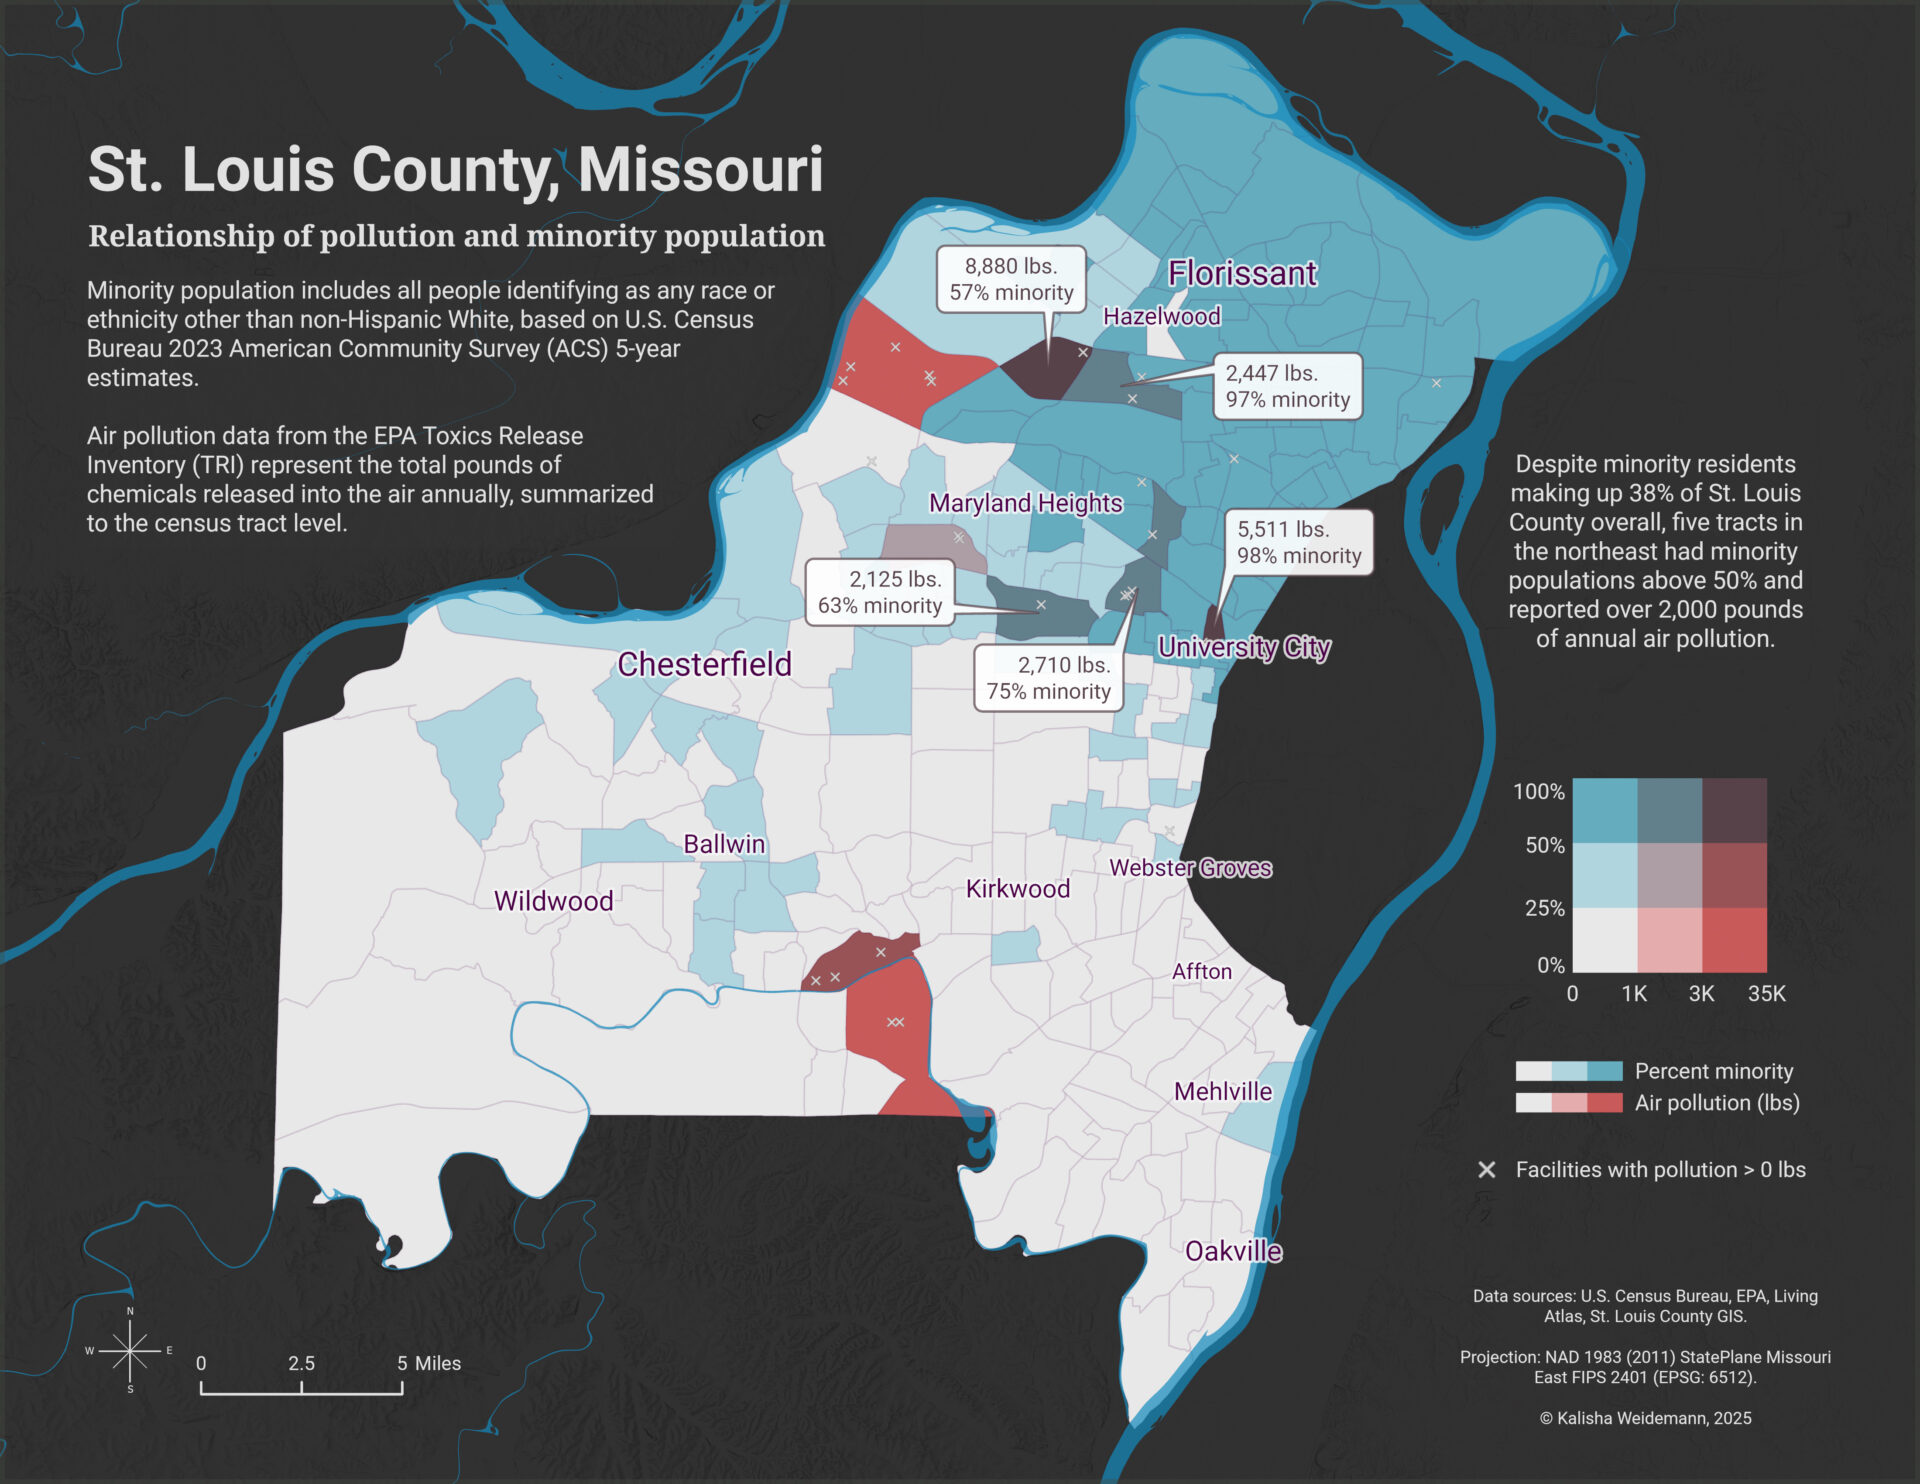
Areas shaded in darker blended tones indicate tracts with both higher minority populations and greater reported emissions. While most tracts show low values for one or both variables, a small cluster of five tracts in the northeast stands out with minority populations above 50 percent and more than 2,000 pounds of annual air pollution.
This overlap suggests localized pollution exposure concerns even though the countywide pattern is weak.
Relationship of air pollution and minority population
The following interactive Tableau dashboard pairs a choropleth map with a scatterplot linking the two variables. While the bivariate choropleth map above shows where higher minority populations and higher air pollution co-occur, the scatterplot in this dashboard explores the strength of the relationship between minority percentage and air pollution across all tracts.
Selecting a census tract in one view highlights it in the other, allowing users to explore specific relationships between percent minority and air-pollution totals.
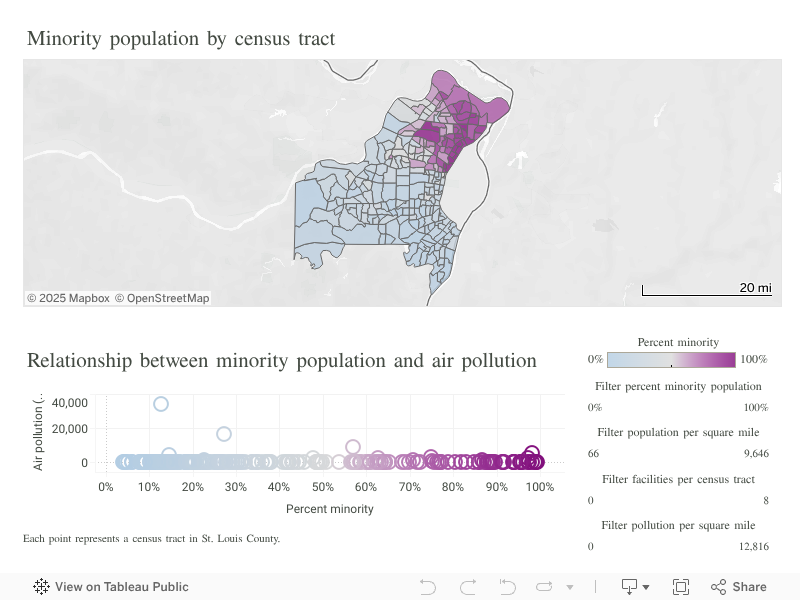
The scatterplot shows a very weak overall correlation, meaning that minority population percentage alone explains little of the variation in reported pollution. However, the interactivity makes it easy to identify outlier tracts dominated by large facilities and to see where localized overlaps occur.
Summary
My research question asked whether there was spatial relationship between air pollution and minority populations in St. Louis County. Overall, St. Louis County’s environmental landscape is characterized by a few industrially intensive tracts surrounded by many areas with negligible emissions.
Although minority populations are concentrated in the county’s northeast, statistical analysis suggests a limited direct relationship between race and air-pollution intensity at the tract level. Still, the maps highlight localized clusters that may warrant further study through spatial or temporal analyses.
Limitations
There are a few limitations worth mentioning:
- Data scope: TRI only includes facilities that are required to report, so smaller emitters or unregulated sources (e.g., vehicles, residential heating) are not captured.
- Resolution: Census tracts can mask finer-scale variation in both population and pollution exposure.
- Temporal mismatch: Population data (ACS 5-year estimates) and TRI emissions (2023 annual) are not perfectly aligned in time.
- Exploratory focus: Current analysis is descriptive/visual; does not establish causation between demographics and pollution.
This was an exploratory project, but future work could strengthen the analysis with spatial statistics, health outcomes, and multi-year data to better understand disparities in exposure.