Investigating whether residential building fires in Modesto are spatially clustered, randomly distributed, or dispersed.
This project applied three point pattern analysis methods — Quadrat count, Average Nearest Neighbor (ANN), and Ripley’s K-function — to evaluate the spatial distribution of 2023 residential building fires in Modesto, California.
Null hypothesis: the residential building fire incidents follow a completely spatially random (CSR) distribution.
Study area
The study area included the cities of Modesto and West Modesto in California, with the exception of the compost facility located roughly nine miles southwest of Modesto city center.
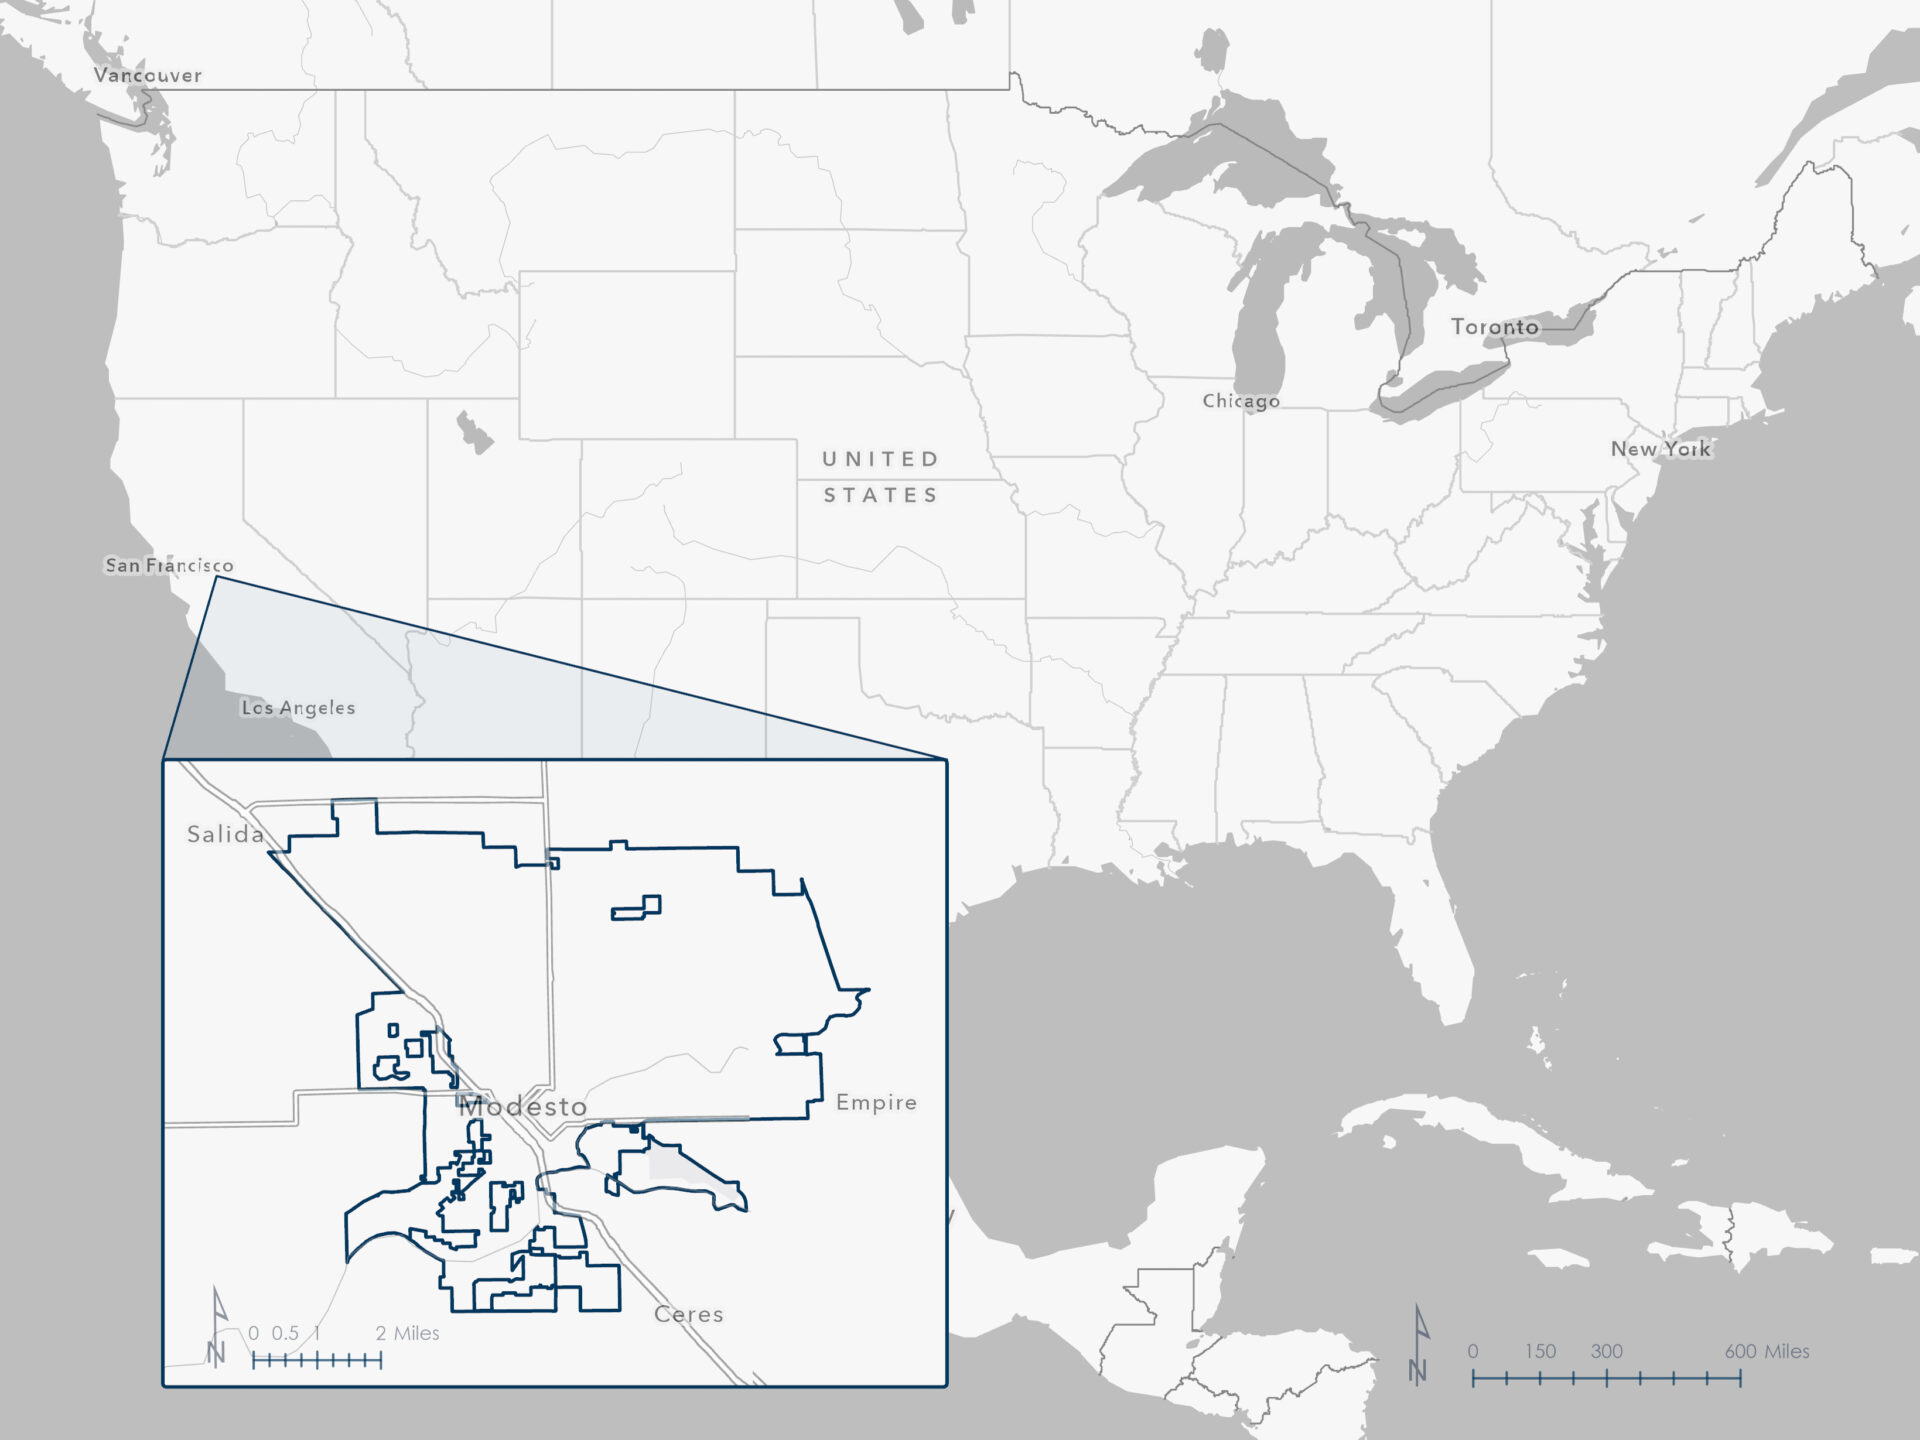
Modesto was selected because it ranked highest in The Hartford’s 2023 Home Fire Index, which identified cities with the greatest risk of residential fire incidents.
Data and workflow
This analysis drew on publicly available GIS datasets from National Fire Incident Reporting System (NFIRS) and the California Open Data Portal.
| Layer | Source | Dataset / service |
|---|---|---|
| Residential building fires | FEMA | 2023 All Incidents GeoPackage |
| Modesto | California Open Data Portal | CA Places Boundaries |
All spatial data were downloaded on July 30, 2025 and projected to NAD 1983 (2011) StatePlane California I FIPS 0401 (Meters) (EPSG Code: 6415), which was selected to ensure accurate distance measurements in meters across the Modesto study area.
This project relied on incident-level fire data from the National Fire Incident Reporting System (NFIRS). The following summary, drawn from FEMA’s public dataset description, outlines the purpose and scope of this system:
The annual National Fire Incident Reporting System (NFIRS) Public Data Release files are provided by the U.S. Fire Administration’s (USFA) National Fire Data Center (NFDC). The NFIRS is a reporting standard that fire departments use to uniformly report on the full range of their activities, from fire to emergency medical services (EMS) to equipment involved in the response.
NFIRS is the nation’s largest, national, annual database of fire incident information. NFIRS is a voluntary tool with two objectives: to help State and local governments develop fire reporting and analysis capability for their own use and to obtain data that can be used to more accurately assess and subsequently combat the fire problem at a national level.
Due to the irregular shape of the study area (i.e., the Modesto city boundary), I was concerned about edge effects introducing bias into the analysis. To address this, I conducted the point pattern analysis under three different conditions:
- Using the city boundary as the study area in ArcGIS Pro, applying density and distance-based tools with built-in edge correction and spatial constraints.
- Defining a square grid that encloses the city boundary, then performing density and distance-based analyses in ArcGIS Pro to reduce edge effects caused by irregular geometry.
- Using the city boundary as the study area in R, where I used the spatstat package to perform point pattern analysis.
The resulting statistics varied across the three methods, though all indicated some evidence of spatial clustering. Comparing these methods in detail is outside the scope of this project, so this report focuses on the first workflow: using the city boundary as the study area and analyzing it in ArcGIS Pro.
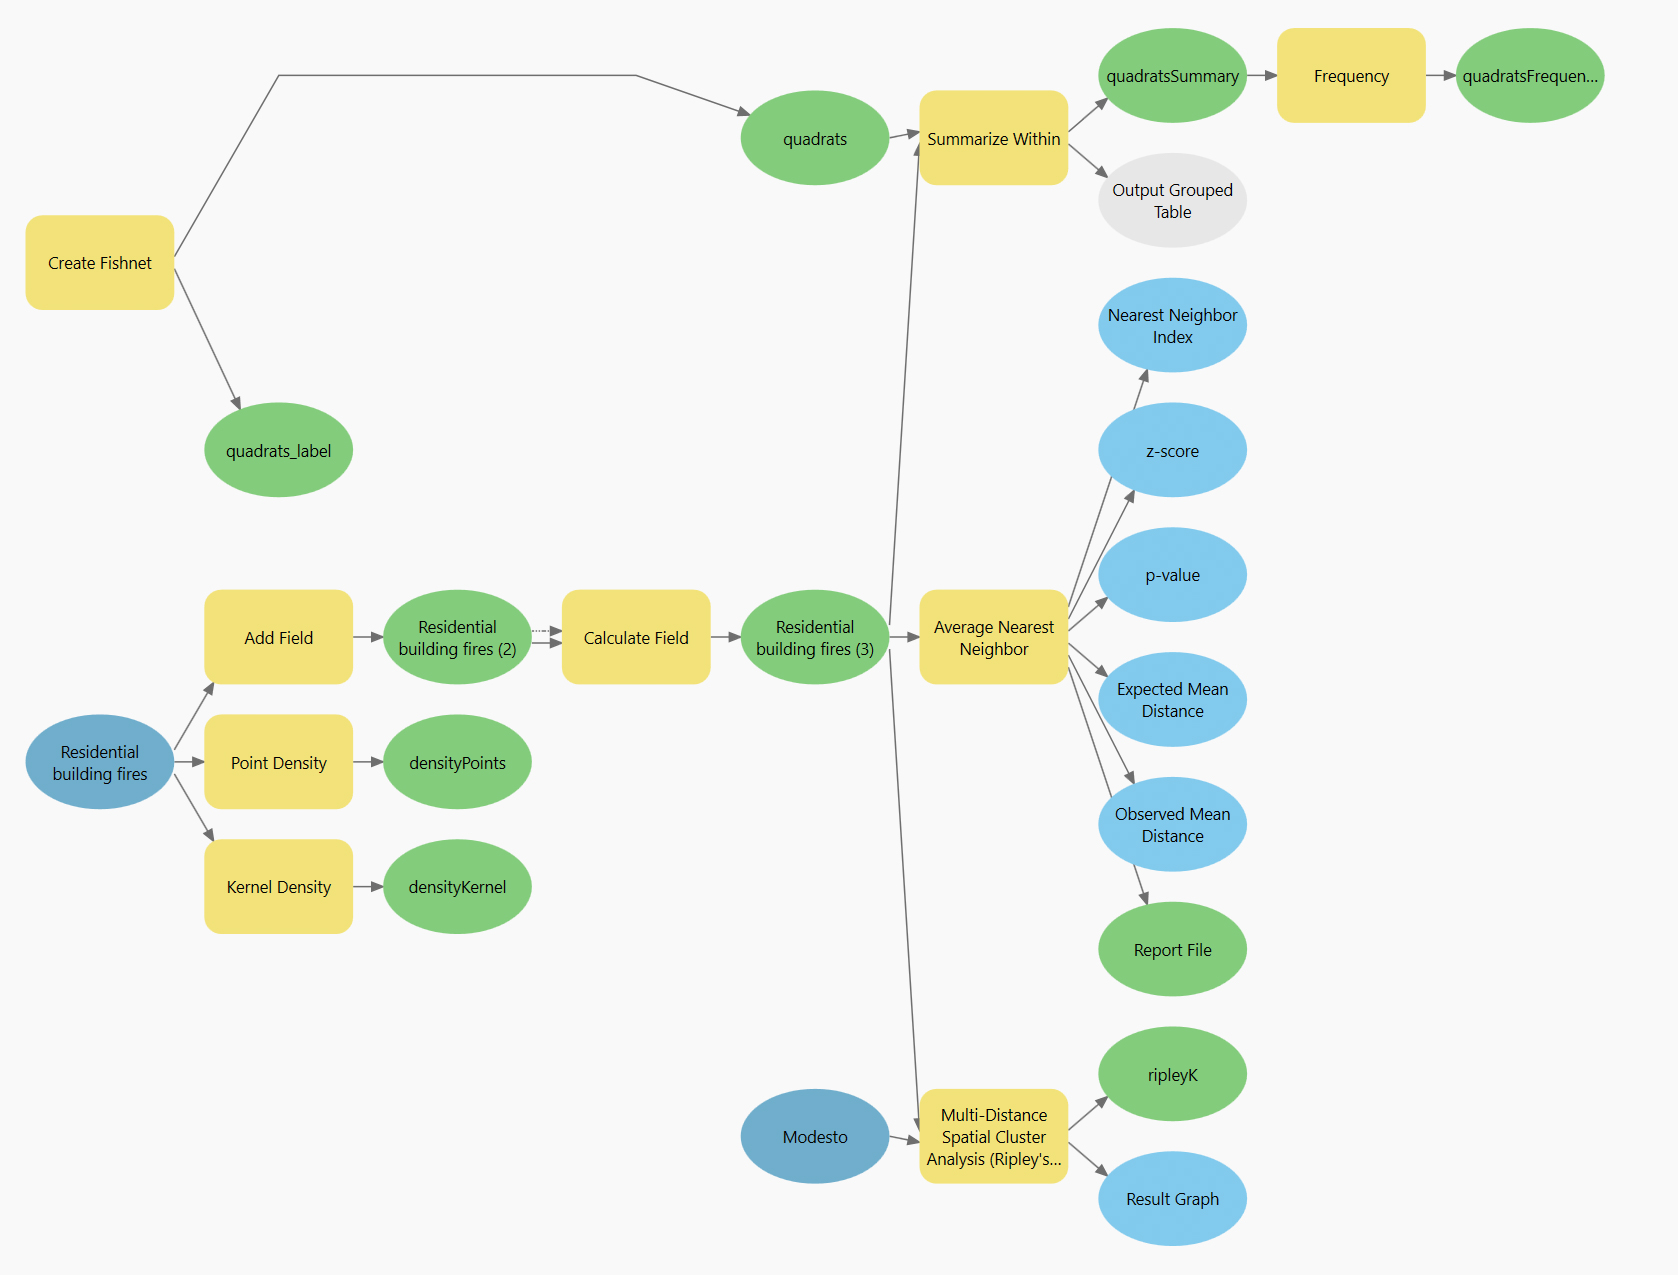
To isolate only the residential building fire points within the study area, I performed spatial and attribute-based queries on the NFIRS GeoPackage. I began by joining two attribute tables — main.basicincident and main.fireincident — to the main.incidentaddress feature class, which contains the incident point geometry.

Once joined, I applied the following SQL expression to filter incidents that matched the NFIRS 5.0 criteria for residential structures (NFIRS Fire Data Analysis Guidelines and Issues, page 23), excluded mutual aid-only responses, and intersected the Modesto city boundary:
main.basicincident.AID NOT IN ('3', '4')
AND main.basicincident.INC_TYPE IN (111, 120, 122)
AND main.fireincident.STRUC_TYPE IN (1, 2)
AND main.basicincident.PROP_USE IN (
    '400', '419', '429', '439', '449',
    '459', '460', '462', '464'
)
The filtering process resulted in 105 points, each representing a residential building fire incident in 2023.
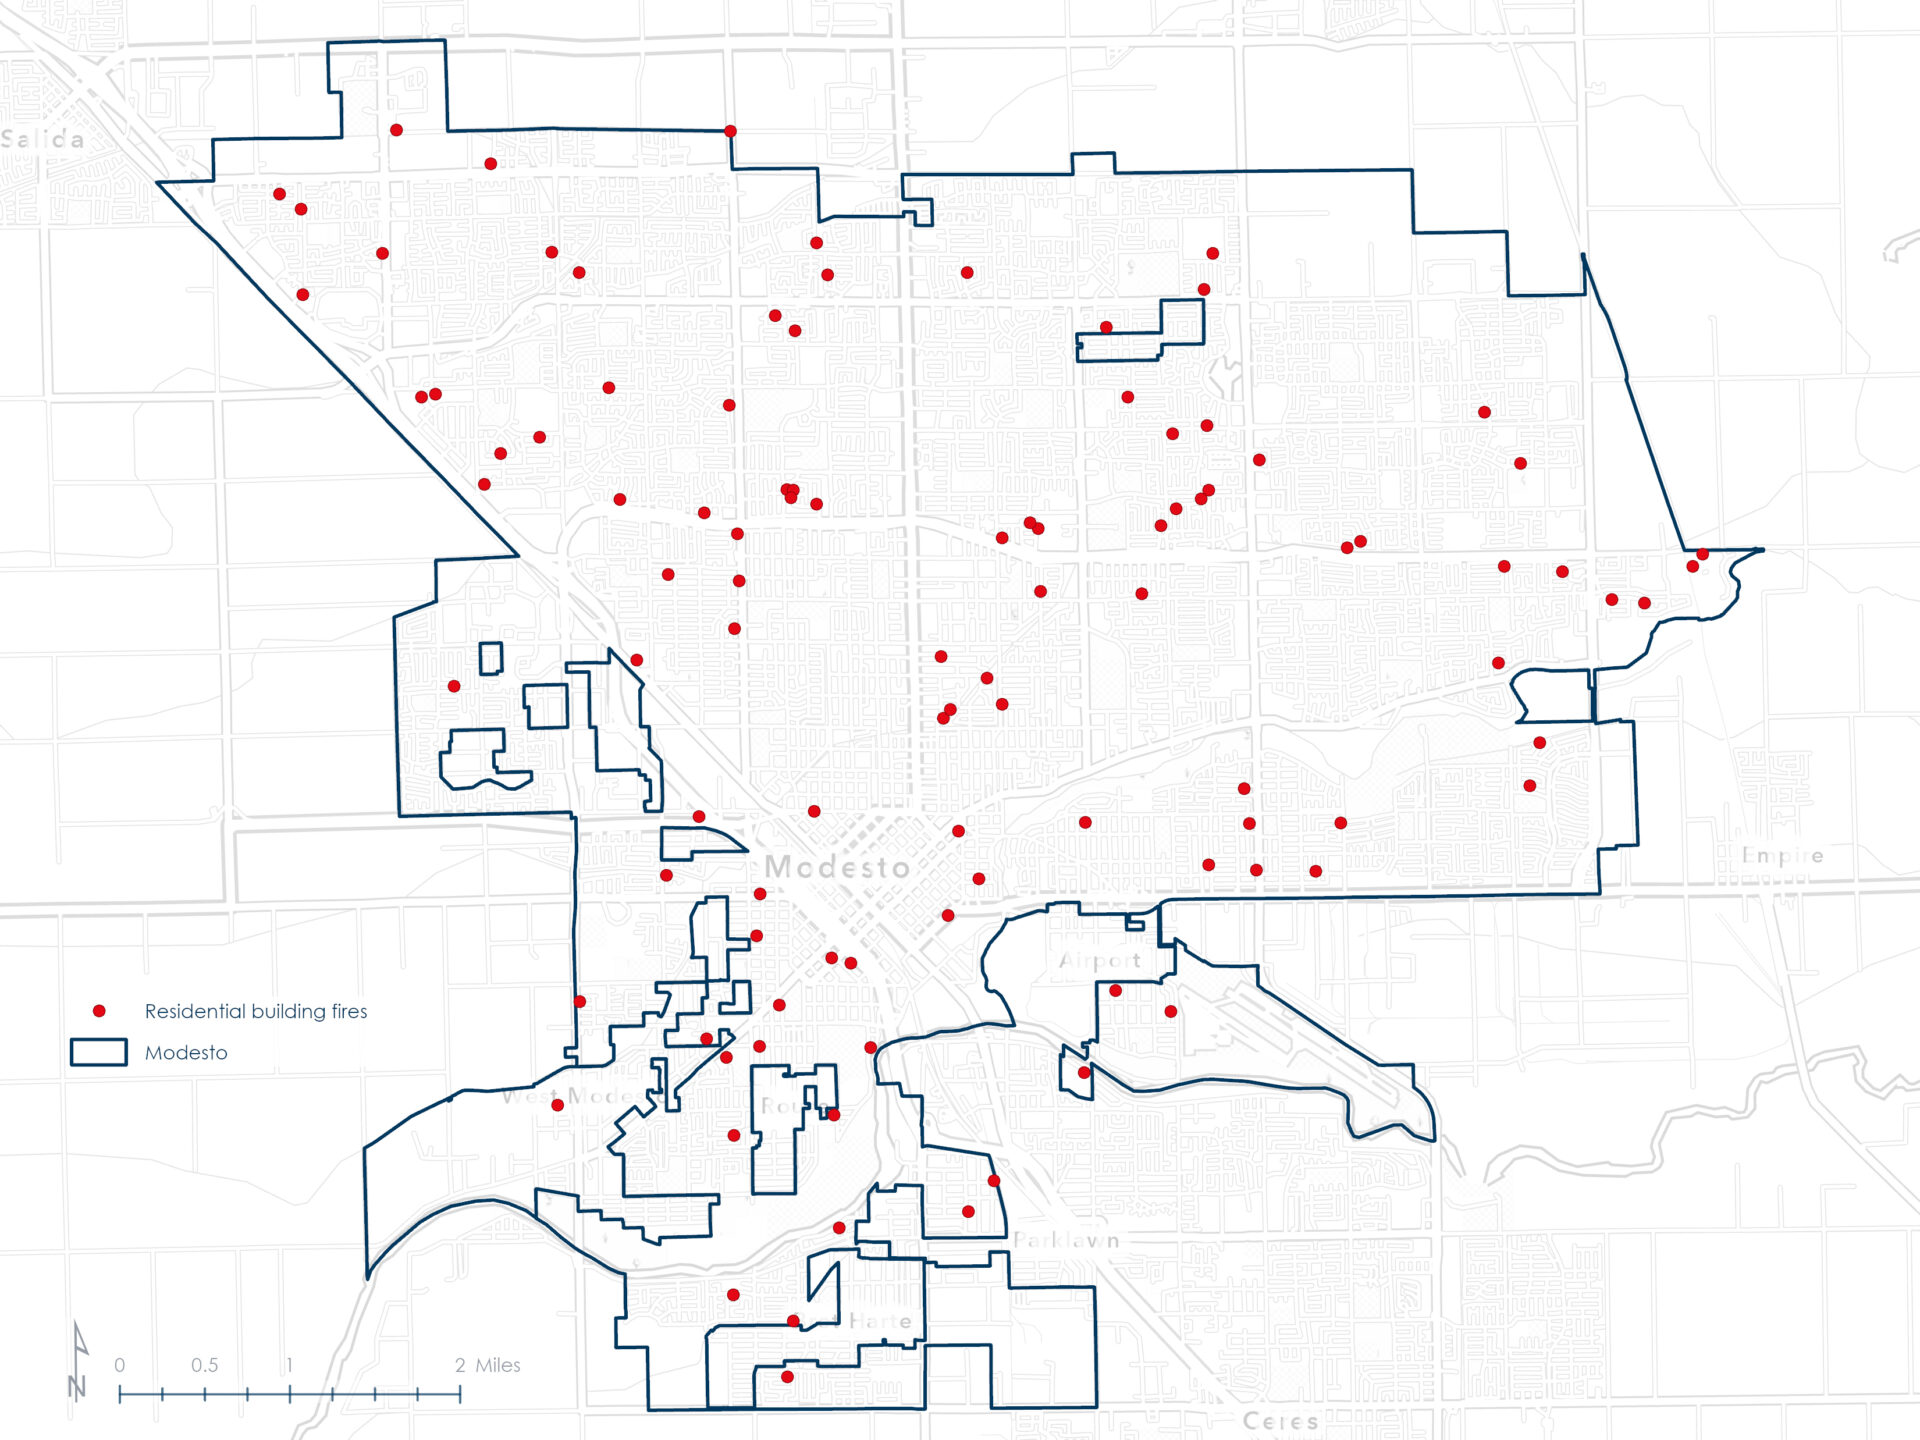
The points were exported to a layer titled Residential building fires that was used for the point pattern analysis.
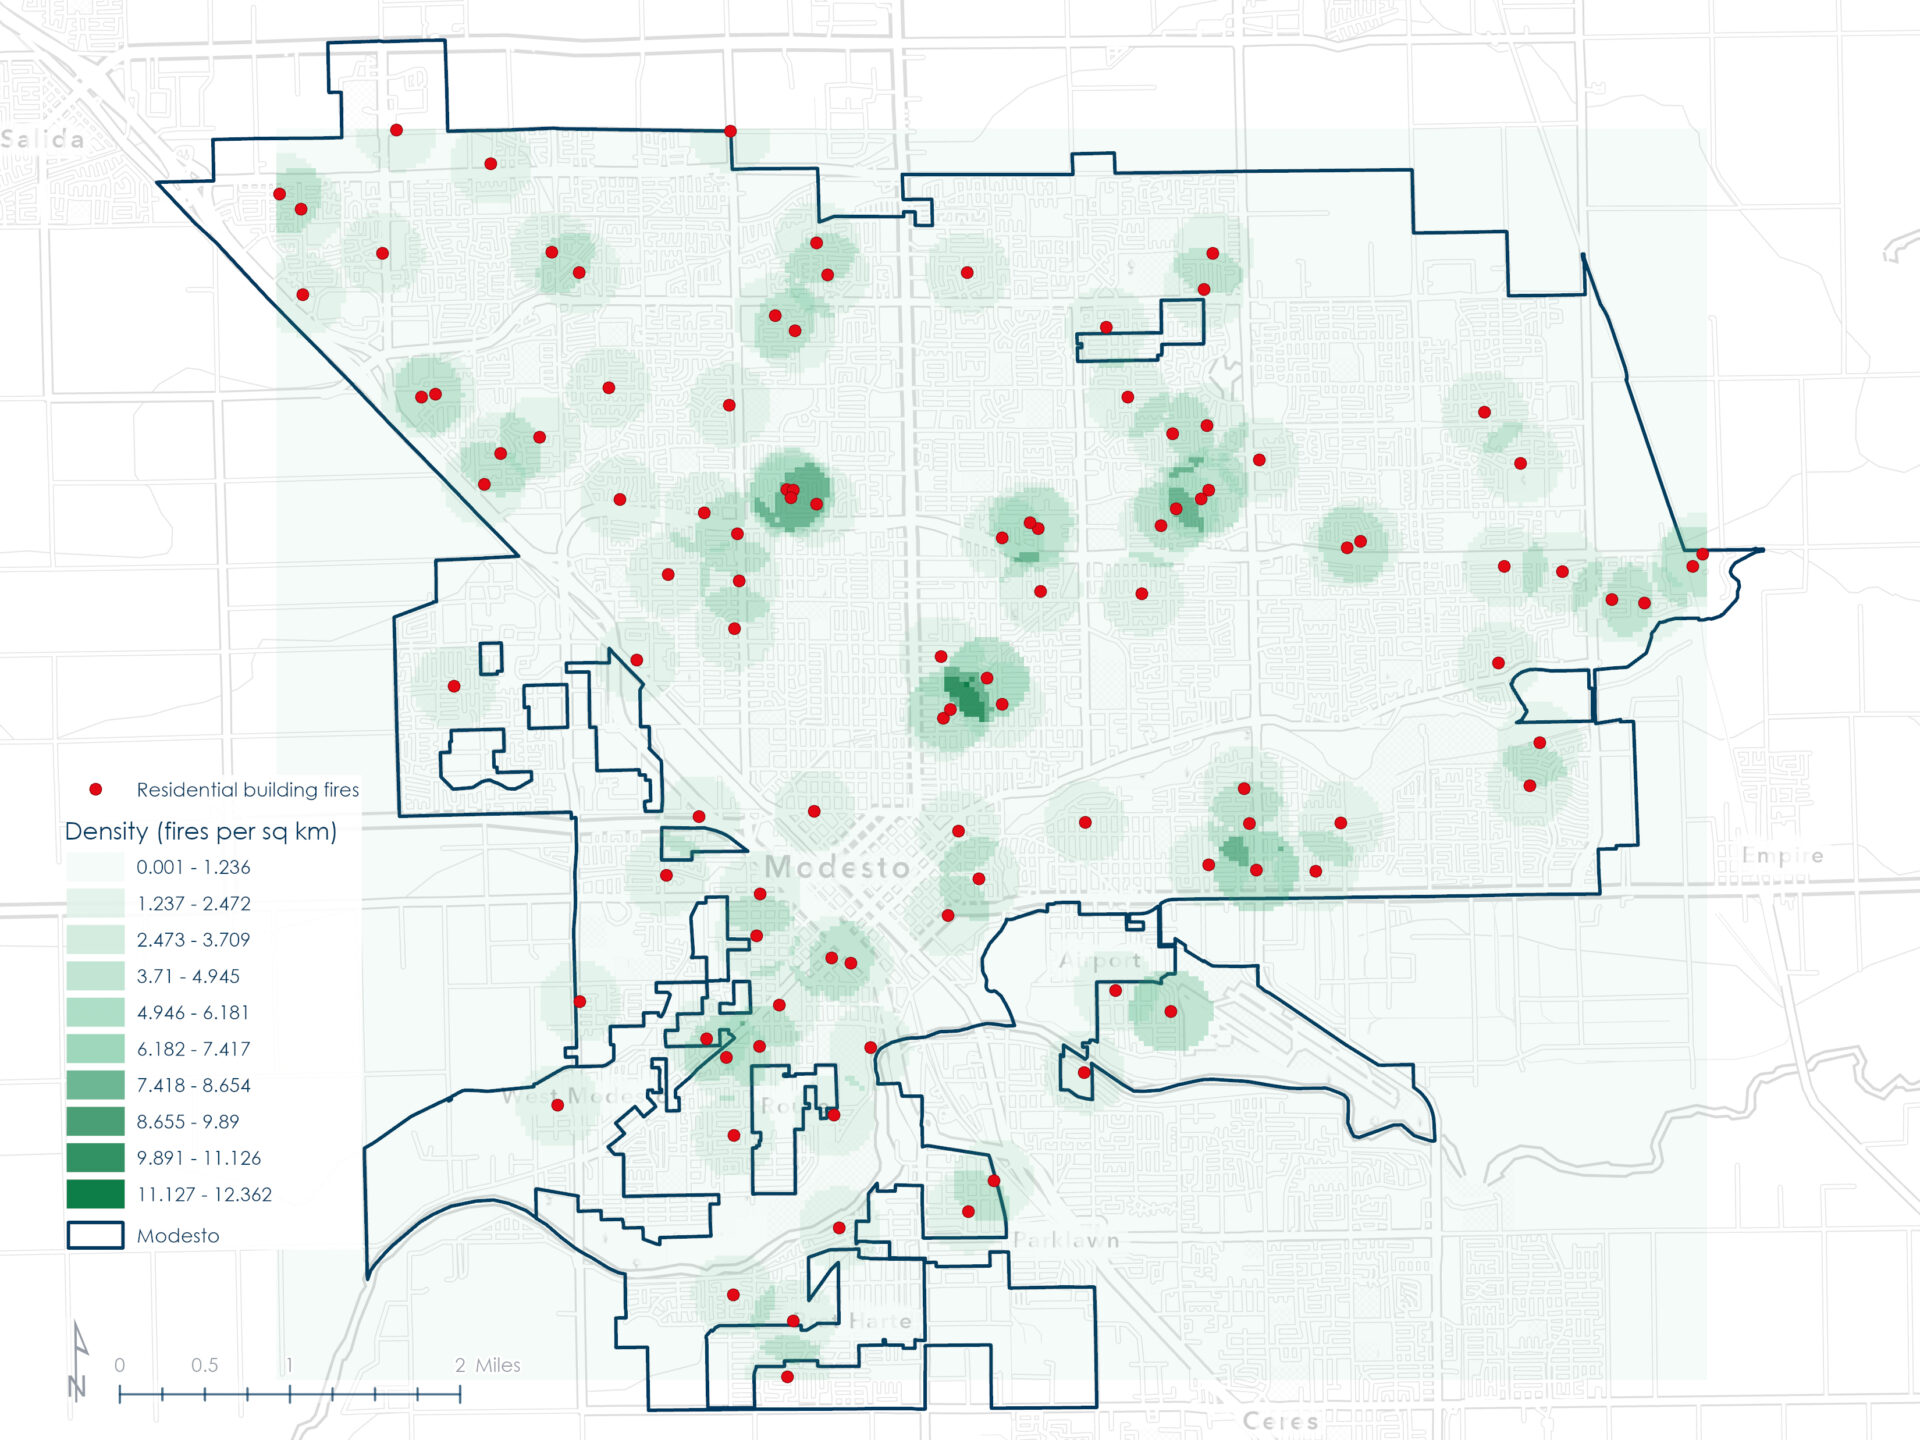
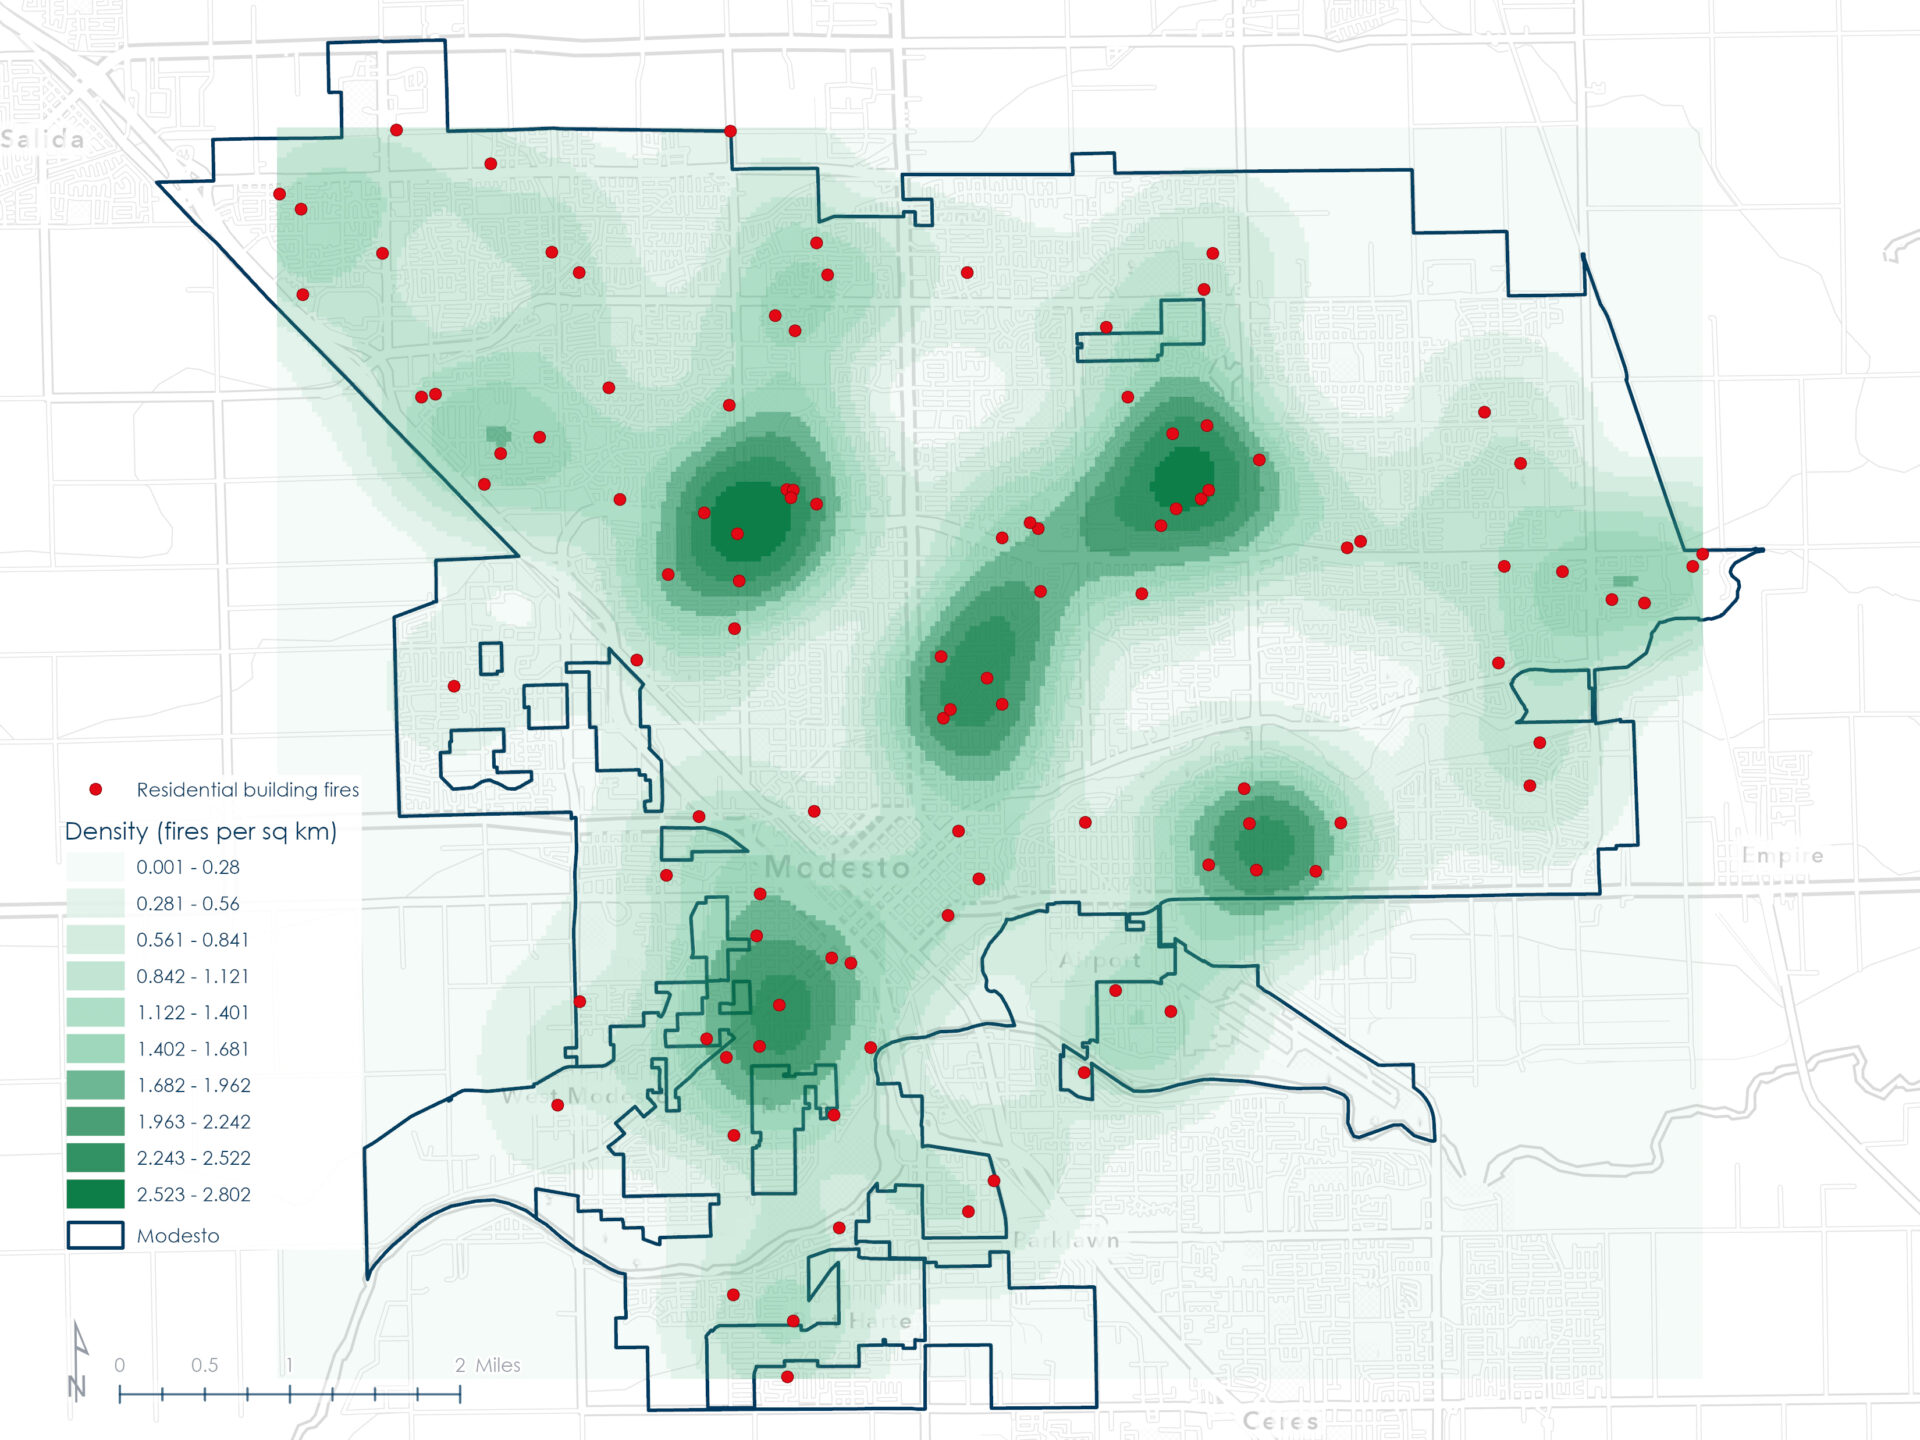
The following maps provide a visual overview of the residential building fire points and their spatial intensity. The first map shows the individual point locations, while the second presents a kernel density surface highlighting areas of higher fire concentration within the study area.
Quadrat count
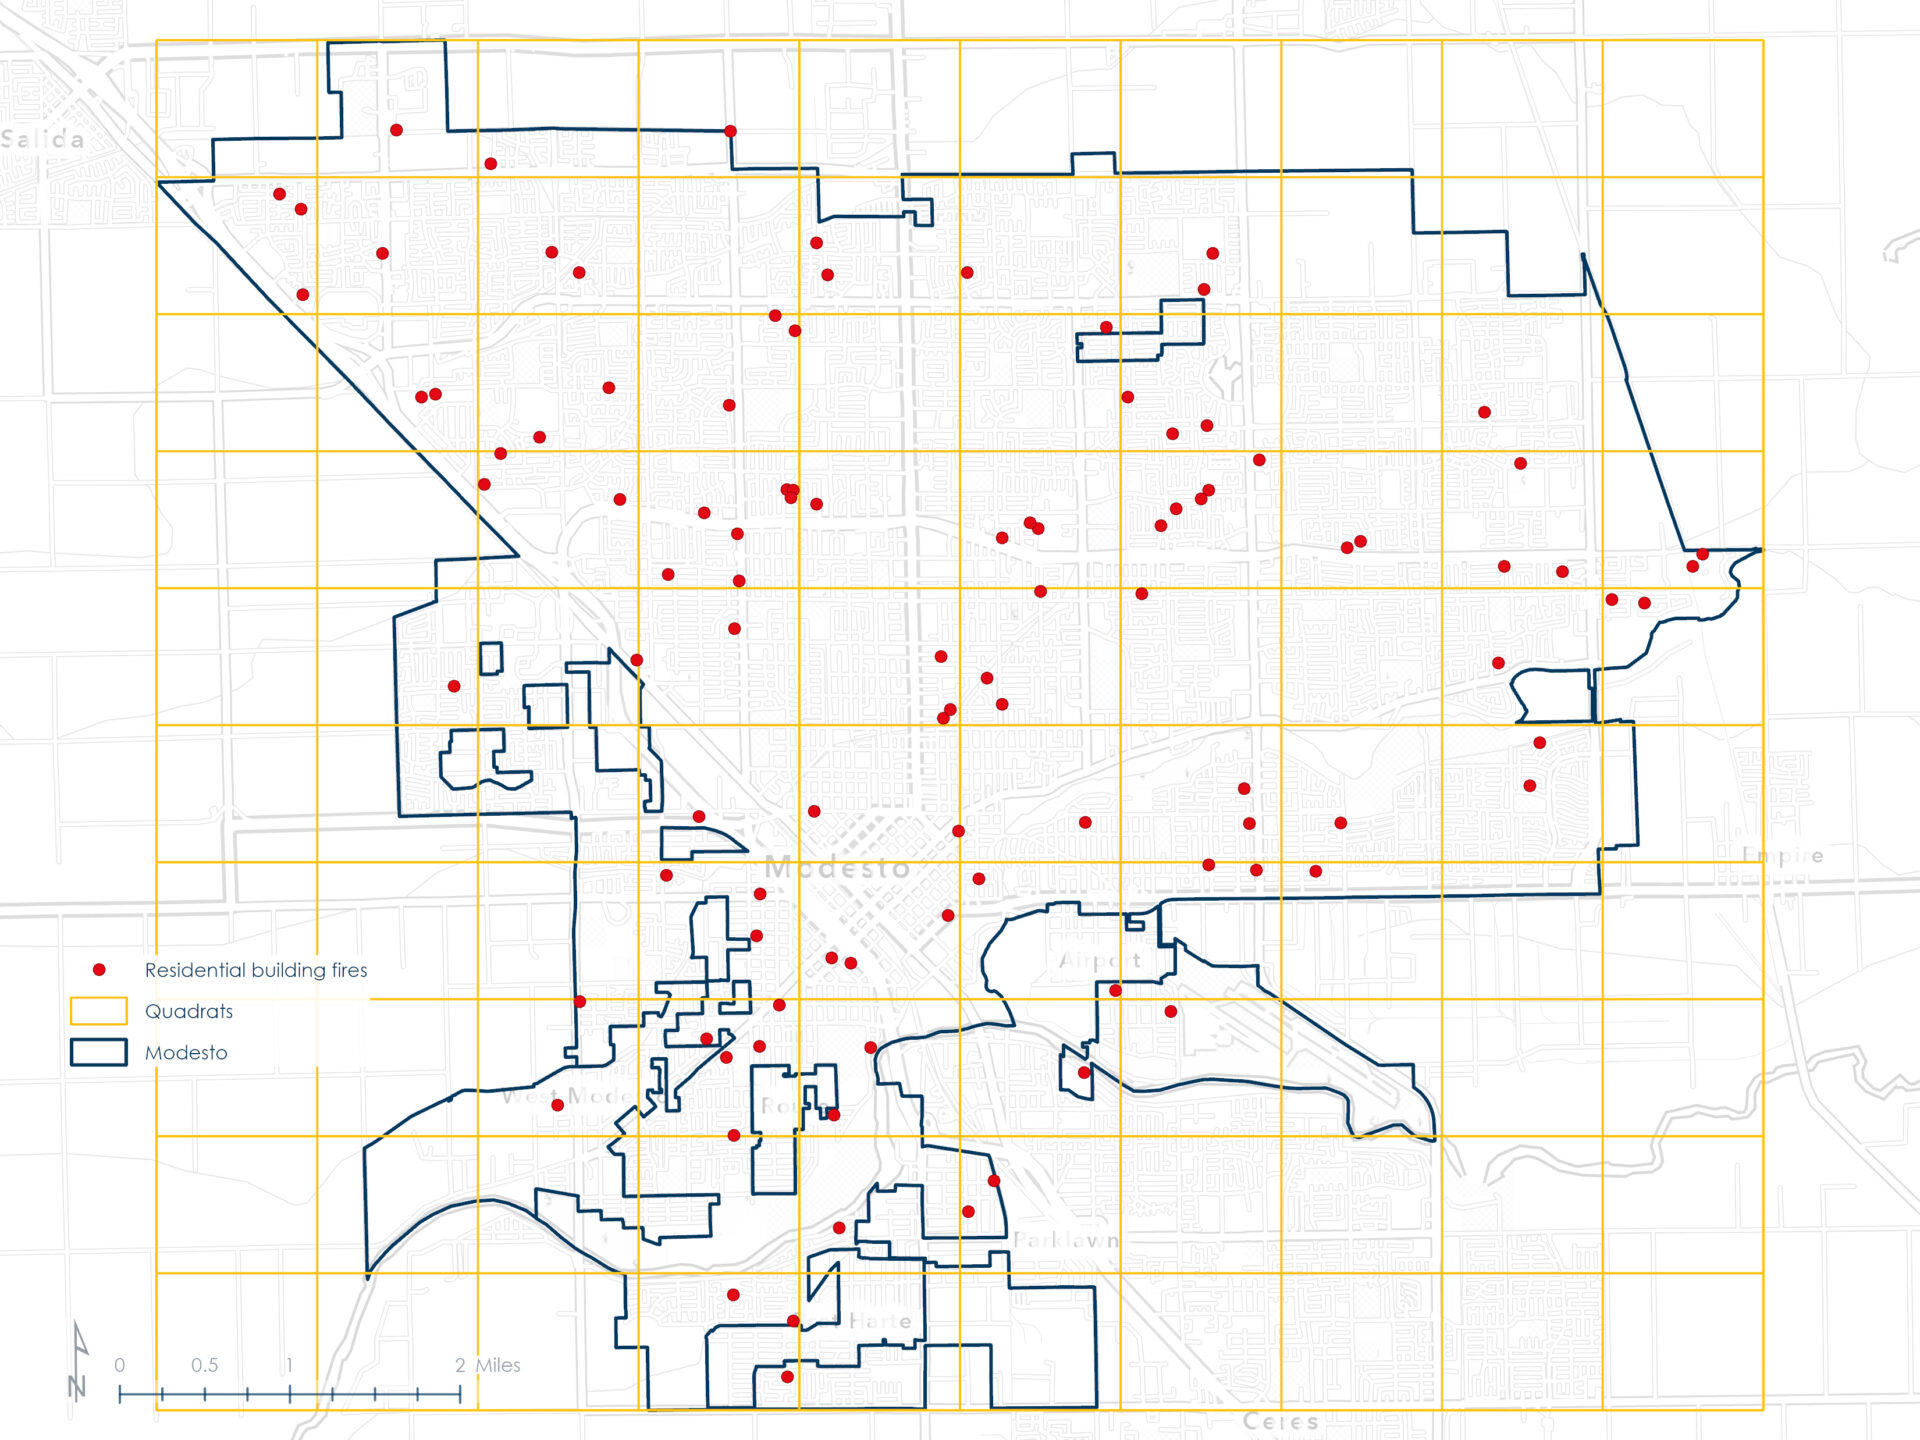
The quadrat count method divides a study area into equally sized grid cells (quadrats) and counts how many points fall within each cell. This method allows for a statistical evaluation of spatial distribution by comparing the observed variance of counts to the mean count.
In this project, a 10×10 fishnet grid (100 cells) was used to assess clustering of residential building fires across the Modesto study area.
The quadrat count analysis showed a mean event count of 1.05 across 100 quadrats.
| Total number of incidents, n | 105 | |||
| Total number of quadrats, x | 100 | |||
| Mean quadrat count | 1.05 | |||
| # of Events, K | # of Quadrats, X | K – μ | (K – μ)^2 | X(K – μ)^2 |
| 0 | 50 | -1.05 | 1.10 | 55.13 |
| 1 | 19 | -0.05 | 0.00 | 0.05 |
| 2 | 16 | 0.95 | 0.90 | 14.44 |
| 3 | 11 | 1.95 | 3.80 | 41.83 |
| 4 | 1 | 2.95 | 8.70 | 8.70 |
| 5 | 2 | 3.95 | 15.60 | 31.21 |
| 7 | 1 | 5.95 | 35.40 | 35.40 |
| Total | 186.75 | |||
| Observed variance | 1.89 | |||
| Variance-to-mean ratio (VMR) | 1.80 | |||
| The observed pattern is: | Clustered | |||
The observed variance was 1.89, yielding a variance-to-mean ratio (VMR) of 1.80. Since the VMR was greater than 1, the pattern of residential building fires in Modesto was interpreted as clustered.
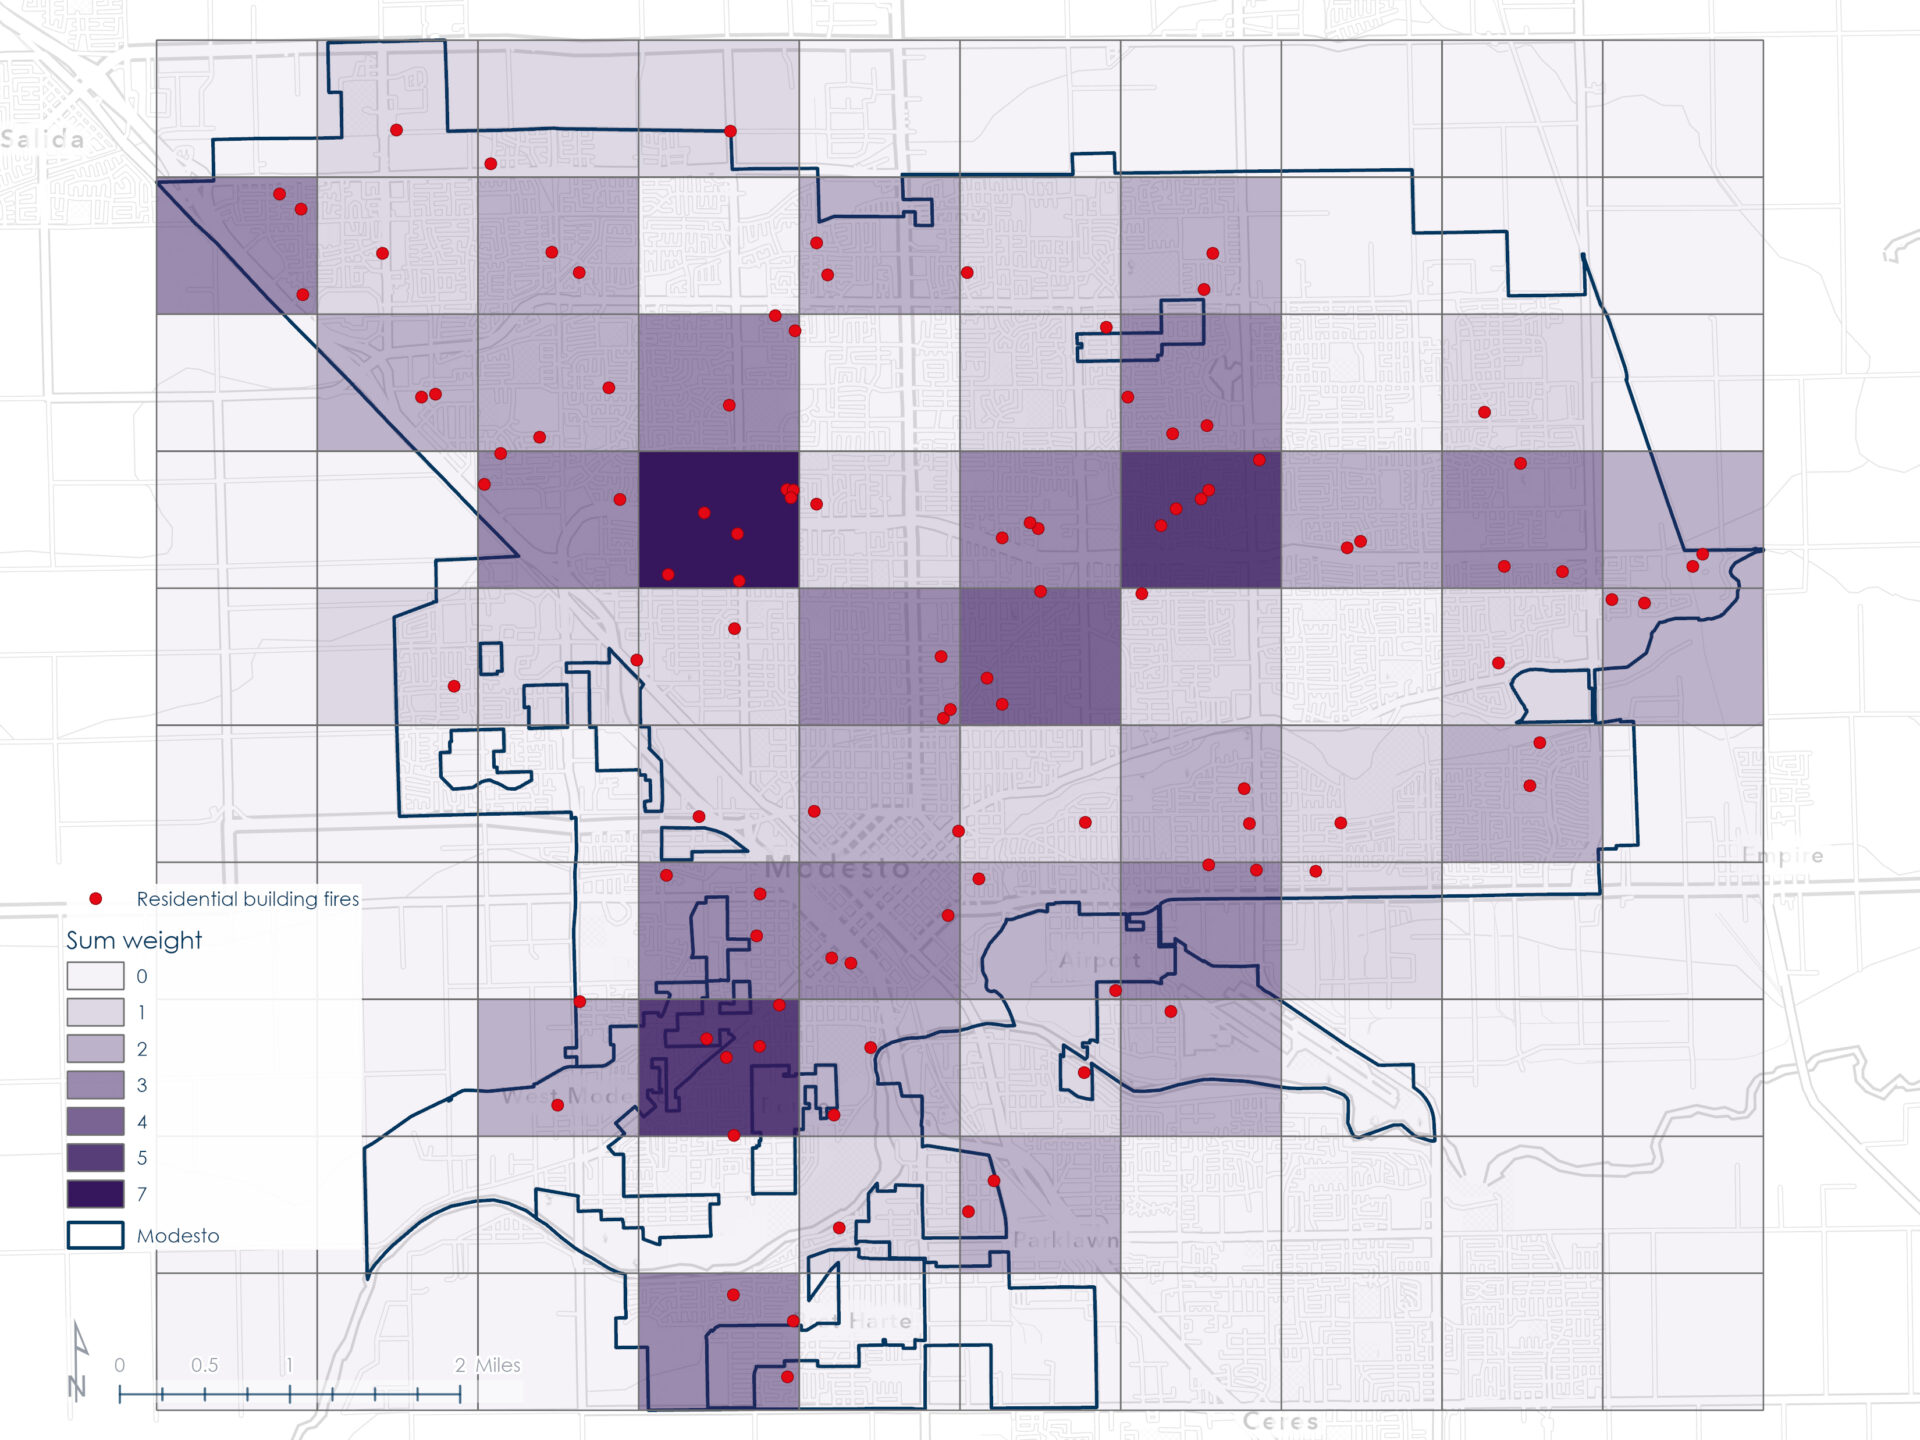
Most quadrats (50) contained zero incidents, while a few quadrats contained multiple residential fires — including one with as many as seven — contributing to the high variance and supporting the conclusion of spatial clustering.
Average Nearest Neighbor (ANN)
The Average Nearest Neighbor (ANN) method measures the average distance between each point and its closest neighboring point. This observed value is compared to the expected mean distance under Complete Spatial Randomness (CSR), assuming a uniform point distribution across the study area.
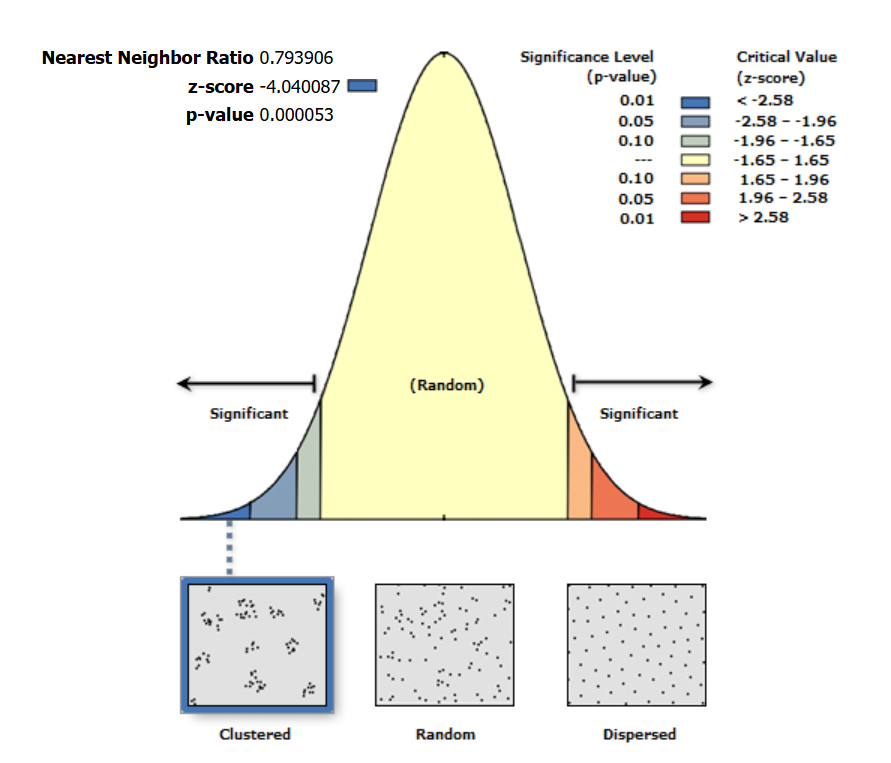
Given the z-score of -4.040087, there is a less than 1% likelihood that this clustered pattern could be the result of random chance.
Average Nearest Neighbor summary
- Observed Mean Distance: 454.4232 meters
- Expected Mean Distance: 572.3892 meters
- Nearest Neighbor Ratio: 0.793906
- z-score: -4.040087
- p-value: 0.000053
Dataset information
- Input Feature Class: Residential building fires
- Distance Method: Euclidean
- Study Area: 137604332.298519
- Selection Set: False
The observed mean distance between points was 454.42 meters, compared to an expected distance of 572.39 meters under CSR. The resulting ANN ratio of 0.7939, combined with a z-score of -4.04 and p-value of 0.000053, indicated a statistically significant clustered pattern.
These results suggest that residential building fires in Modesto were not randomly distributed but exhibited spatial clustering within the study area.
Ripley’s K-function
Ripley’s K-function was used to evaluate spatial clustering across multiple distance bands by comparing the observed spatial distribution of fire incidents to expectations under Complete Spatial Randomness (CSR).
The analysis was run in ArcGIS Pro using the Multi-Distance Spatial Cluster Analysis (Ripley’s K Function) tool with 999 Monte Carlo simulations to generate a confidence envelope.
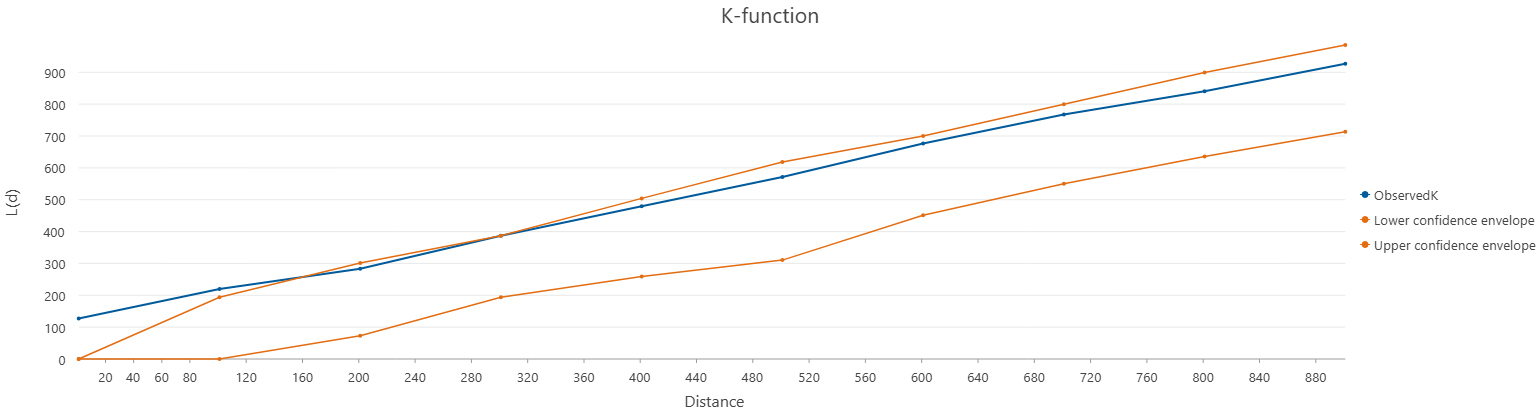
The observed K-values exceeded the expected values at all tested distance bands, with points at smaller distances falling outside the upper confidence envelope, suggesting clustering patterns at those distances.
Conclusion
All three point pattern analysis methods indicated that the residential building fire points were clustered rather than randomly or uniformly distributed, reasonably rejecting the null hypothesis.
The Quadrat count method yielded a Variance-to-Mean Ratio (VMR) of 1.80, consistent with clustering. The ANN method produced a nearest neighbor ratio of 0.79 and a highly significant z-score of -4.04, further supporting a clustered pattern. Ripley’s K-function confirmed clustering, particularly at smaller distances.
These findings suggest that residential fires in Modesto tend to occur in spatial concentrations, potentially reflecting underlying risk factors.
Several limitations should be noted, however.
First, NFIRS participation is voluntary, and reporting completeness may vary between jurisdictions and years. Per the National Fire Incident Reporting System Version 5.0 Fire Data Analysis Guidelines and Issues (July 2011):
Any analysis of the NFIRS data should note that NFIRS is neither a random sample nor a census of fire incidents or casualties in the United States. As such, the analyst may not accurately make estimates of total fires, fire losses, or fire casualties in the United States from NFIRS data alone.
This could introduce data gaps or regional inconsistencies in the dataset.
Second, the irregular shape of the Modesto city boundary may have introduced edge effects, particularly for distance-based methods like ANN and K-function, and may have reduced the reliability of quadrat count estimates where grid cells were partially clipped or excluded.
Third, the analysis relied solely on 2023 incident data and did not control for covariates such as housing density, land use, or fire station coverage, which may have influenced the spatial pattern.
Finally, this was my first exposure to the NFIRS datasets which potentially limited both the analysis and interpretation of the results. There is much to learn about fire data analysis.
Software and tools
This analysis was conducted using ArcGIS Pro 3.5.2, with an emphasis on the Spatial Analyst and Spatial Statistics tools.
All spatial data were downloaded on July 30, 2025 and projected to NAD 1983 (2011) StatePlane California I FIPS 0401 (Meters) (EPSG Code: 6415) prior to analysis.
Citations
California Open Data Portal. CA Places Boundaries [Data set]. https://data.ca.gov/dataset/ca-geographic-boundaries/resource/436fc714-831c-4070-b44b-b06dcde6bf18
Federal Emergency Management Agency (FEMA). Annual NFIRS Public Data [Data set]. https://www.fema.gov/about/openfema/data-sets/fema-usfa-nfirs-annual-data. This product uses the FEMA OpenFEMA API, but is not endorsed by FEMA. The Federal Government or FEMA cannot vouch for the data or analyses derived from these data after the data have been retrieved from the Agency’s website(s).
Federal Emergency Management Agency (FEMA). National Fire Incident Reporting System Version 5.0: Fire Data Analysis Guidelines and Issues. https://www.usfa.fema.gov/downloads/pdf/nfirs/nfirs_data_analysis_guidelines_issues.pdf
The Hartford. The Hartford Junior Fire Marshal Program: Home Fire Risk. https://assets.thehartford.com/image/upload/junior_fire_marshal_infographic_2023.pdf
The Hartford. The Hartford’s 2023 Home Fire Index Uncovers Significant Decrease in Behaviors Causing Home Fires. https://newsroom.thehartford.com/newsroom-home/news-releases/news-release-details/2023/The-Hartfords-2023-Home-Fire-Index-Uncovers-Significant-Decrease-In-Behaviors-Causing-Home-Fires/default.aspx